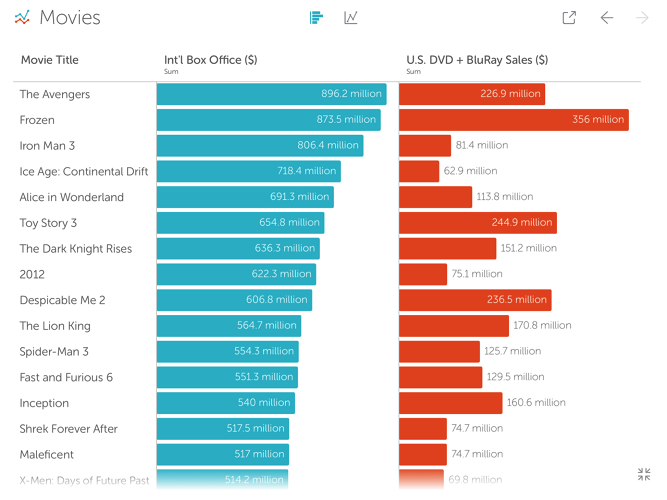
For those who can internalize colorful charts and graphs more effectively than spreadsheets filled with numbers, Vizable is an appropriate solution.
The new iPad app, from Tableau, converts CVS and Excel files into line or bar graphs in seconds, as Fast Company reports. From there, users choose what categories to view, and then swipe and pinch the screen to add columns, change fields, filter, and sort. Results can be shared via email and social media.
Seattle-based Tableau makes similar software for major businesses, but Vizable is meant for everyday users. For example, individuals can use the app to track their purchases, teachers can visualize their students’ test scores, and small businesses can analyze their expenses.
"We want to reach a group of people who don't think they can see and understand this type of data," said Dave Story, Tableau's vice president for mobile growth, in the Fast Company piece. "If someone's kid walks into a room and the app was open, we'd want them to think it's a fun game.
The app, which has been in production for two years, is available on iTunes for free.
Related Stories
| May 24, 2017
Accelerate Live! talk: Applying machine learning to building design, Daniel Davis, WeWork
Daniel Davis offers a glimpse into the world at WeWork, and how his team is rethinking workplace design with the help of machine learning tools.
| May 24, 2017
Accelerate Live! talk: Learning from Silicon Valley - Using SaaS to automate AEC, Sean Parham, Aditazz
Sean Parham shares how Aditazz is shaking up the traditional design and construction approaches by applying lessons from the tech world.
| May 24, 2017
Accelerate Live! talk: The data-driven future for AEC, Nathan Miller, Proving Ground
In this 15-minute talk at BD+C’s Accelerate Live! (May 11, 2017, Chicago), Nathan Miller presents his vision of a data-driven future for the business of design.
Big Data | May 24, 2017
Data literacy: Your data-driven advantage starts with your people
All too often, the narrative of what it takes to be ‘data-driven’ focuses on methods for collecting, synthesizing, and visualizing data.
AEC Tech | May 23, 2017
A funny thing may happen on the way to AI
As AI proves safe, big business will want to reduce overhead.
Building Technology | May 5, 2017
Tips for designing and building with bathroom pods
Advancements in building technology and ongoing concerns about labor shortages make prefabrication options such as bathrooms pods primed for an awakening.
BIM and Information Technology | Apr 24, 2017
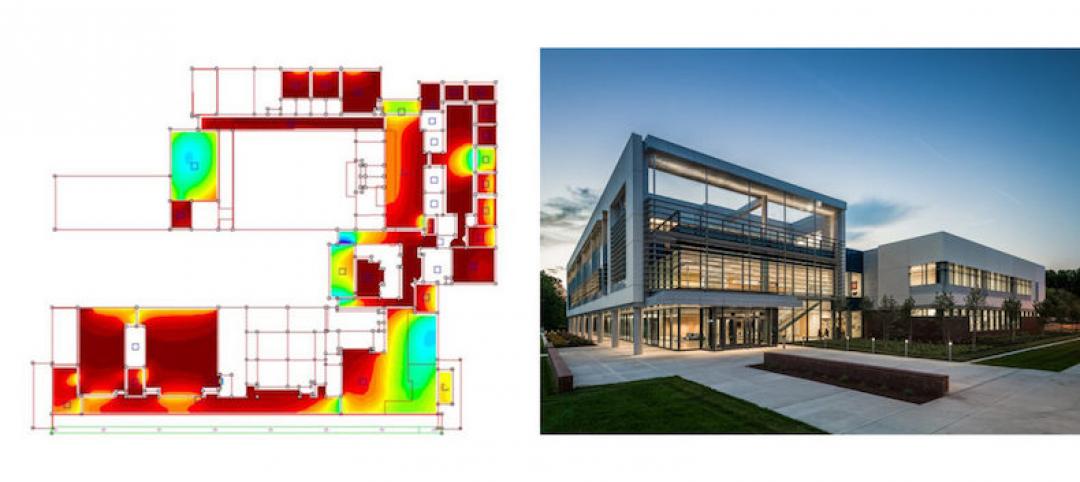
Reconciling design energy models with real world results
Clark Nexsen’s Brian Turner explores the benefits and challenges of energy modeling and discusses how design firms can implement standards for the highest possible accuracy.
BIM and Information Technology | Apr 17, 2017
BIM: What do owners want?
Now more than ever, owners are becoming extremely focused on leveraging BIM to deliver their projects.
Sustainable Design and Construction | Apr 5, 2017
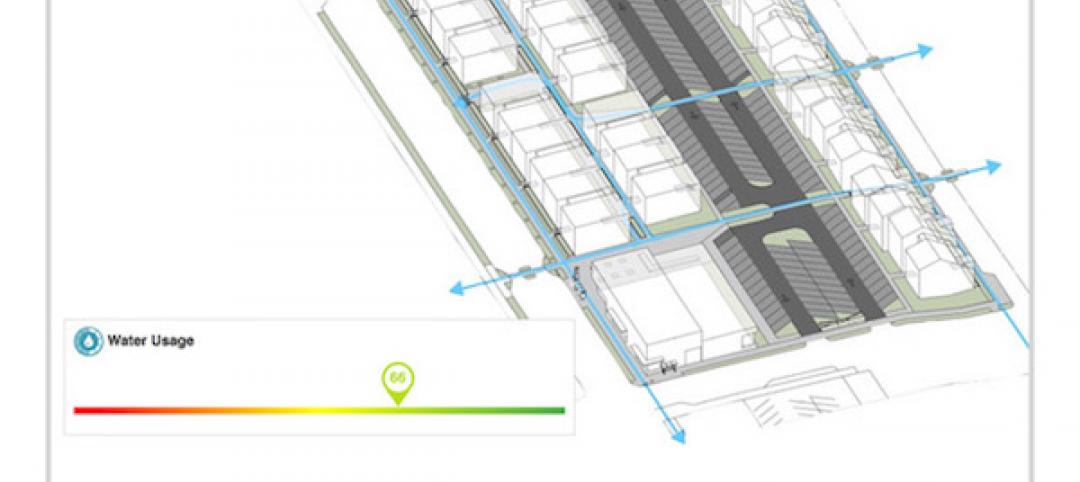
A new app brings precision to designing a building for higher performance
PlanIt Impact's sustainability scoring is based on myriad government and research data.
BIM and Information Technology | Mar 28, 2017
Digital tools accelerated the design and renovation of one contractor’s new office building
One shortcut: sending shop drawings created from laser scans directly to a wood panel fabricator.


