In the third quarter of 2018, the U.S. office market again showed steady improvement, according to Transwestern’s national outlook for the sector. Absorption reached 22.7 million square feet, vacancy remained stable at 10.1%, and asking rents increased by 4.0%, annually.
Ryan Tharp, Research Director in Dallas, said the strong economy has contributed to the office market’s momentum, despite softer income growth in a very tight labor market.
“Real gross domestic product increased at an annualized 3.5%, according to first estimates, and personal consumption contributed 2.7% to that rate,” Tharp said. “Because inflation has remained in line with the Federal Reserve’s target of 2.0%, consumer and business confidence should keep the office market healthy well into 2019.”
A positive sign is that year-to-date net absorption in the office market was 17.1% higher at the end of the third quarter than it was for the same period last year. Dallas-Fort Worth, San Francisco and Denver led in absorption by a significant margin for the prior 12 months, with a combined 13.3 million square feet.
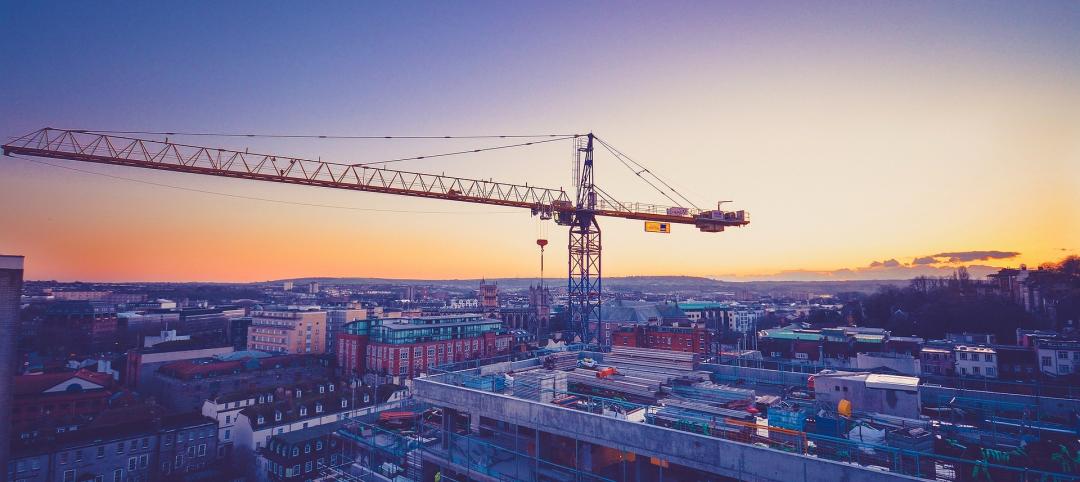
Meanwhile, demand and supply are headed for equilibrium as new construction activity peaked in early 2017. In the third quarter, only 146.3 million square feet was under construction nationally.
“It’s encouraging to see that office demand is broad-based across multiple sectors, with the technology and coworking sectors driving demand as we move later in the cycle,” said Michael Soto, Research Manager in Los Angeles. “If demand continues unabated, rental rate growth should moderate.”
Year-over-year, Minneapolis, San Antonio, and Charlotte, North Carolina, have experienced the most dramatic rent growth, all coming in at 10% or greater. The strong performance of secondary markets demonstrates that the office sector is not being propped up by a few formidable markets.
Download the national office market report at: http://twurls.com/3q18-us-
Related Stories
Construction Costs | May 16, 2024
New download: BD+C's May 2024 Market Intelligence Report
Building Design+Construction's monthly Market Intelligence Report offers a snapshot of the health of the U.S. building construction industry, including the commercial, multifamily, institutional, and industrial building sectors. This report tracks the latest metrics related to construction spending, demand for design services, contractor backlogs, and material price trends.
Contractors | May 15, 2024
The average U.S. contractor has 8.4 months worth of construction work in the pipeline, as of April 2024
Associated Builders and Contractors reported that its Construction Backlog Indicator increased to 8.4 months in April, according to an ABC member survey conducted April 22 to May 6. The reading is down 0.5 months from April 2023, but expanded 0.2 months from the prior month.
Healthcare Facilities | May 6, 2024
Hospital construction costs for 2024
Data from Gordian breaks down the average cost per square foot for a three-story hospital across 10 U.S. cities.
Contractors | May 1, 2024
Nonresidential construction spending rises 0.2% in March 2024 to $1.19 trillion
National nonresidential construction spending increased 0.2% in March, according to an Associated Builders and Contractors analysis of data published today by the U.S. Census Bureau. On a seasonally adjusted annualized basis, nonresidential spending totaled $1.19 trillion.
AEC Tech | Apr 30, 2024
Lack of organizational readiness is biggest hurdle to artificial intelligence adoption
Managers of companies in the industrial sector, including construction, have bought the hype of artificial intelligence (AI) as a transformative technology, but their organizations are not ready to realize its promise, according to research from IFS, a global cloud enterprise software company. An IFS survey of 1,700 senior decision-makers found that 84% of executives anticipate massive organizational benefits from AI.
Hotel Facilities | Apr 24, 2024
The U.S. hotel construction market sees record highs in the first quarter of 2024
As seen in the Q1 2024 U.S. Hotel Construction Pipeline Trend Report from Lodging Econometrics (LE), at the end of the first quarter, there are 6,065 projects with 702,990 rooms in the pipeline. This new all-time high represents a 9% year-over-year (YOY) increase in projects and a 7% YOY increase in rooms compared to last year.
Construction Costs | Apr 18, 2024
New download: BD+C's April 2024 Market Intelligence Report
Building Design+Construction's monthly Market Intelligence Report offers a snapshot of the health of the U.S. building construction industry, including the commercial, multifamily, institutional, and industrial building sectors. This report tracks the latest metrics related to construction spending, demand for design services, contractor backlogs, and material price trends.
Market Data | Apr 16, 2024
The average U.S. contractor has 8.2 months worth of construction work in the pipeline, as of March 2024
Associated Builders and Contractors reported today that its Construction Backlog Indicator increased to 8.2 months in March from 8.1 months in February, according to an ABC member survey conducted March 20 to April 3. The reading is down 0.5 months from March 2023.
K-12 Schools | Apr 10, 2024
Surprise, surprise: Students excel in modernized K-12 school buildings
Too many of the nation’s school districts are having to make it work with less-than-ideal educational facilities. But at what cost to student performance and staff satisfaction?
Multifamily Housing | Apr 9, 2024
March reports record gains in multifamily rent growth in 20 months
Asking rents for multifamily units increased $8 during the month to $1,721; year-over-year growth grew 30 basis points to 0.9 percent—a normal seasonal growth pattern according to Yardi Matrix.


