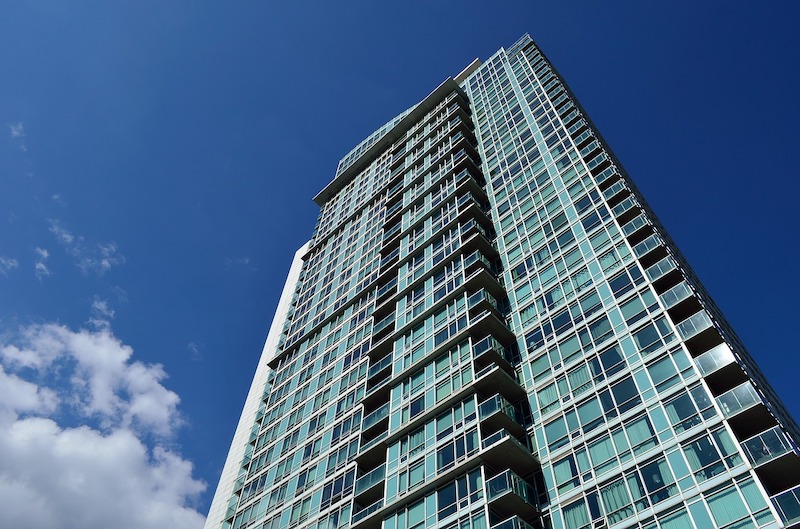
The average U.S. multifamily rent reached an all-time high of $1,409 in July. Rents increased 2.8% year-over-year with the $3 increase from June and have risen 3% year-to-date, according to a survey of 127 markets by Yardi® Matrix.
The July performance arose from strong second-quarter economic growth and healthy demand. "One could say the market is experiencing typical summer growth, a good sign considering the length of the cycle, which has some worried that the party might be nearing its end," the report says. "Economic conditions remain favorable for the multifamily industry, especially in secondary markets that are leading the nation in employment growth."
The year-over-year rent growth leaders remained virtually unchanged from June: Orlando, Fla., Las Vegas, California's Inland Empire and Phoenix. Sacramento, Calif., replaced Tampa, Fla., in the fifth spot. Rents grew year-over-year in each of the country's top 30 metros in July.
View the full Yardi Matrix Multifamily National Report for July 2018 for additional detail and insight into 127 major U.S. real estate markets.
Yardi Matrix offers the industry's most comprehensive market intelligence tool for investment professionals, equity investors, lenders and property managers who underwrite and manage investments in commercial real estate. Yardi Matrix covers multifamily, industrial, office and self storage property types.
Related Stories
Market Data | Apr 18, 2019
ABC report: 'Confidence seems to be making a comeback in America'
The Construction Confidence Index remained strong in February, according to the Associated Builders and Contractors.
Market Data | Apr 16, 2019
ABC’s Construction Backlog Indicator rebounds in February
ABC's Construction Backlog Indicator expanded to 8.8 months in February 2019.
Market Data | Apr 8, 2019
Engineering, construction spending to rise 3% in 2019: FMI outlook
Top-performing segments forecast in 2019 include transportation, public safety, and education.
Market Data | Apr 1, 2019
Nonresidential spending expands again in February
Private nonresidential spending fell 0.5% for the month and is only up 0.1% on a year-over-year basis.
Market Data | Mar 22, 2019
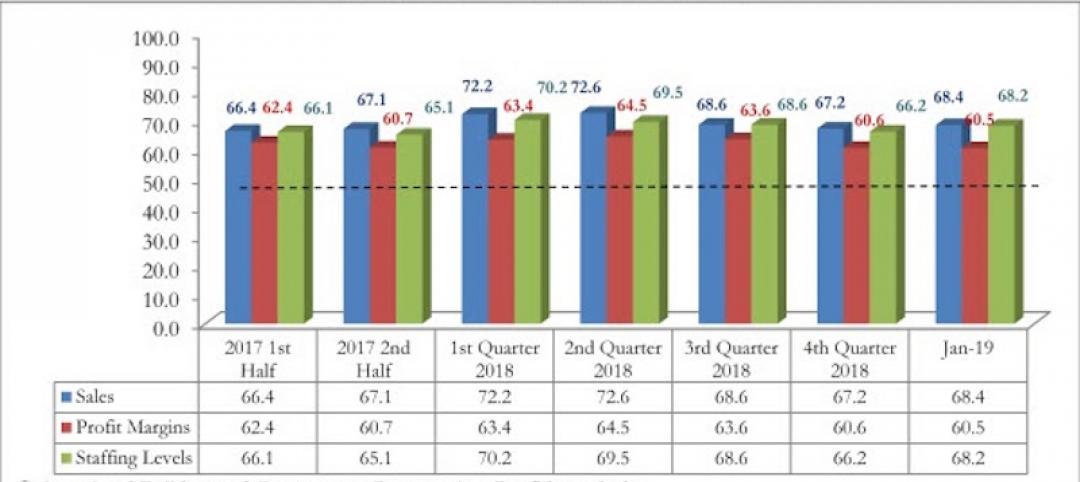
Construction contractors regain confidence in January 2019
Expectations for sales during the coming six-month period remained especially upbeat in January.
Market Data | Mar 21, 2019
Billings moderate in February following robust New Year
AIA’s Architecture Billings Index (ABI) score for February was 50.3, down from 55.3 in January.
Market Data | Mar 19, 2019
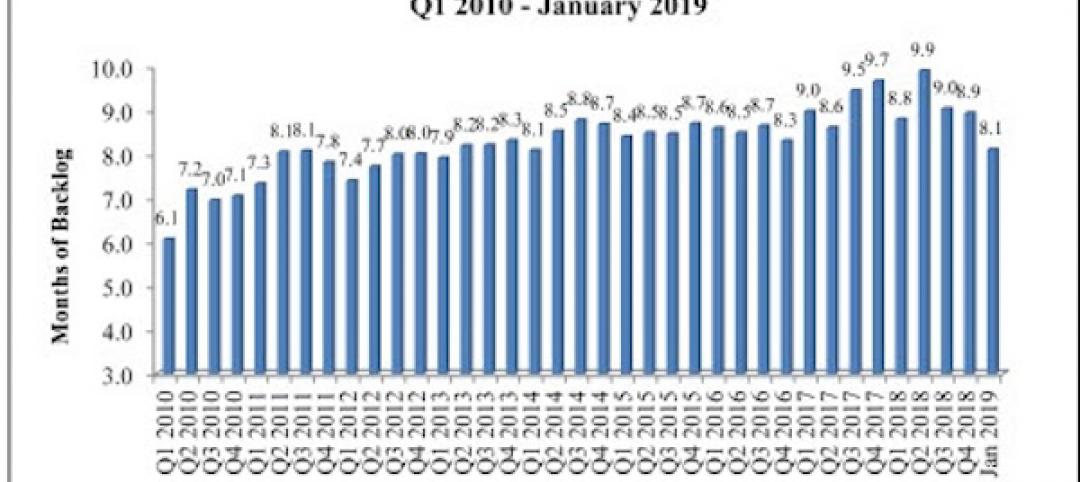
ABC’s Construction Backlog Indicator declines sharply in January 2019
The Construction Backlog Indicator contracted to 8.1 months during January 2019.
Market Data | Mar 15, 2019
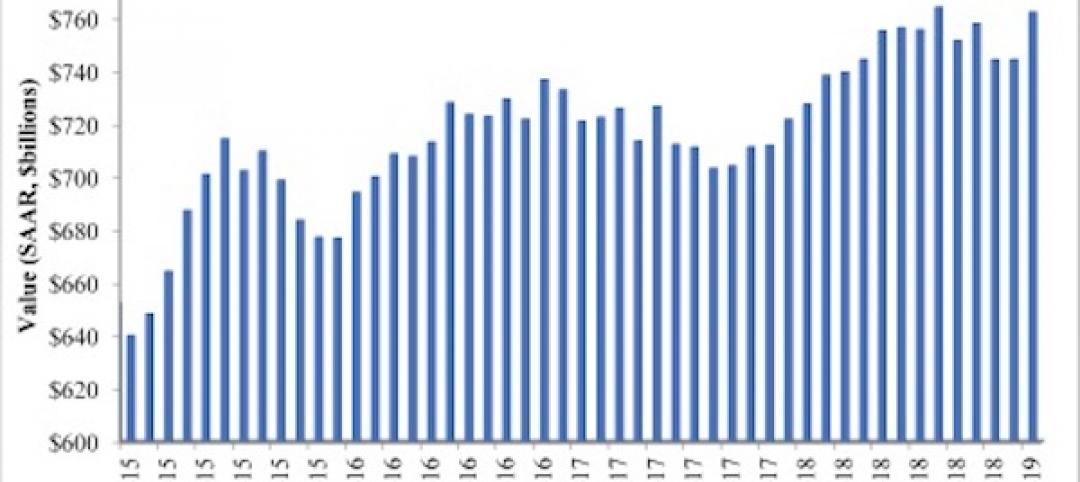
2019 starts off with expansion in nonresidential spending
At a seasonally adjusted annualized rate, nonresidential spending totaled $762.5 billion for the month.
Market Data | Mar 14, 2019
Construction input prices rise for first time since October
Of the 11 construction subcategories, seven experienced price declines for the month.
Market Data | Mar 6, 2019
Global hotel construction pipeline hits record high at 2018 year-end
There are a record-high 6,352 hotel projects and 1.17 million rooms currently under construction worldwide.


