The U.S. Green Building Council last week launched an online data visualization resource that highlights real-time green building data for each state in the U.S. and Washington, D.C.
The enhanced state market briefs—which highlight LEED projects, LEED-credentialed professionals, and USGBC membership in each state—provide green building advocates and the general public a look into LEED’s impact within any U.S. state.
The market briefs were created to supply green building advocates with on-the-ground information to tell robust stories about the multifaceted benefits of LEED green buildings. Each market brief acts as a state-level barometer of economic activity taking place in the green building industry.
Market briefs for countries outside the U.S. are available upon request, and LEED for Homes and LEED for Neighborhood Development data and projects will be added later this year.
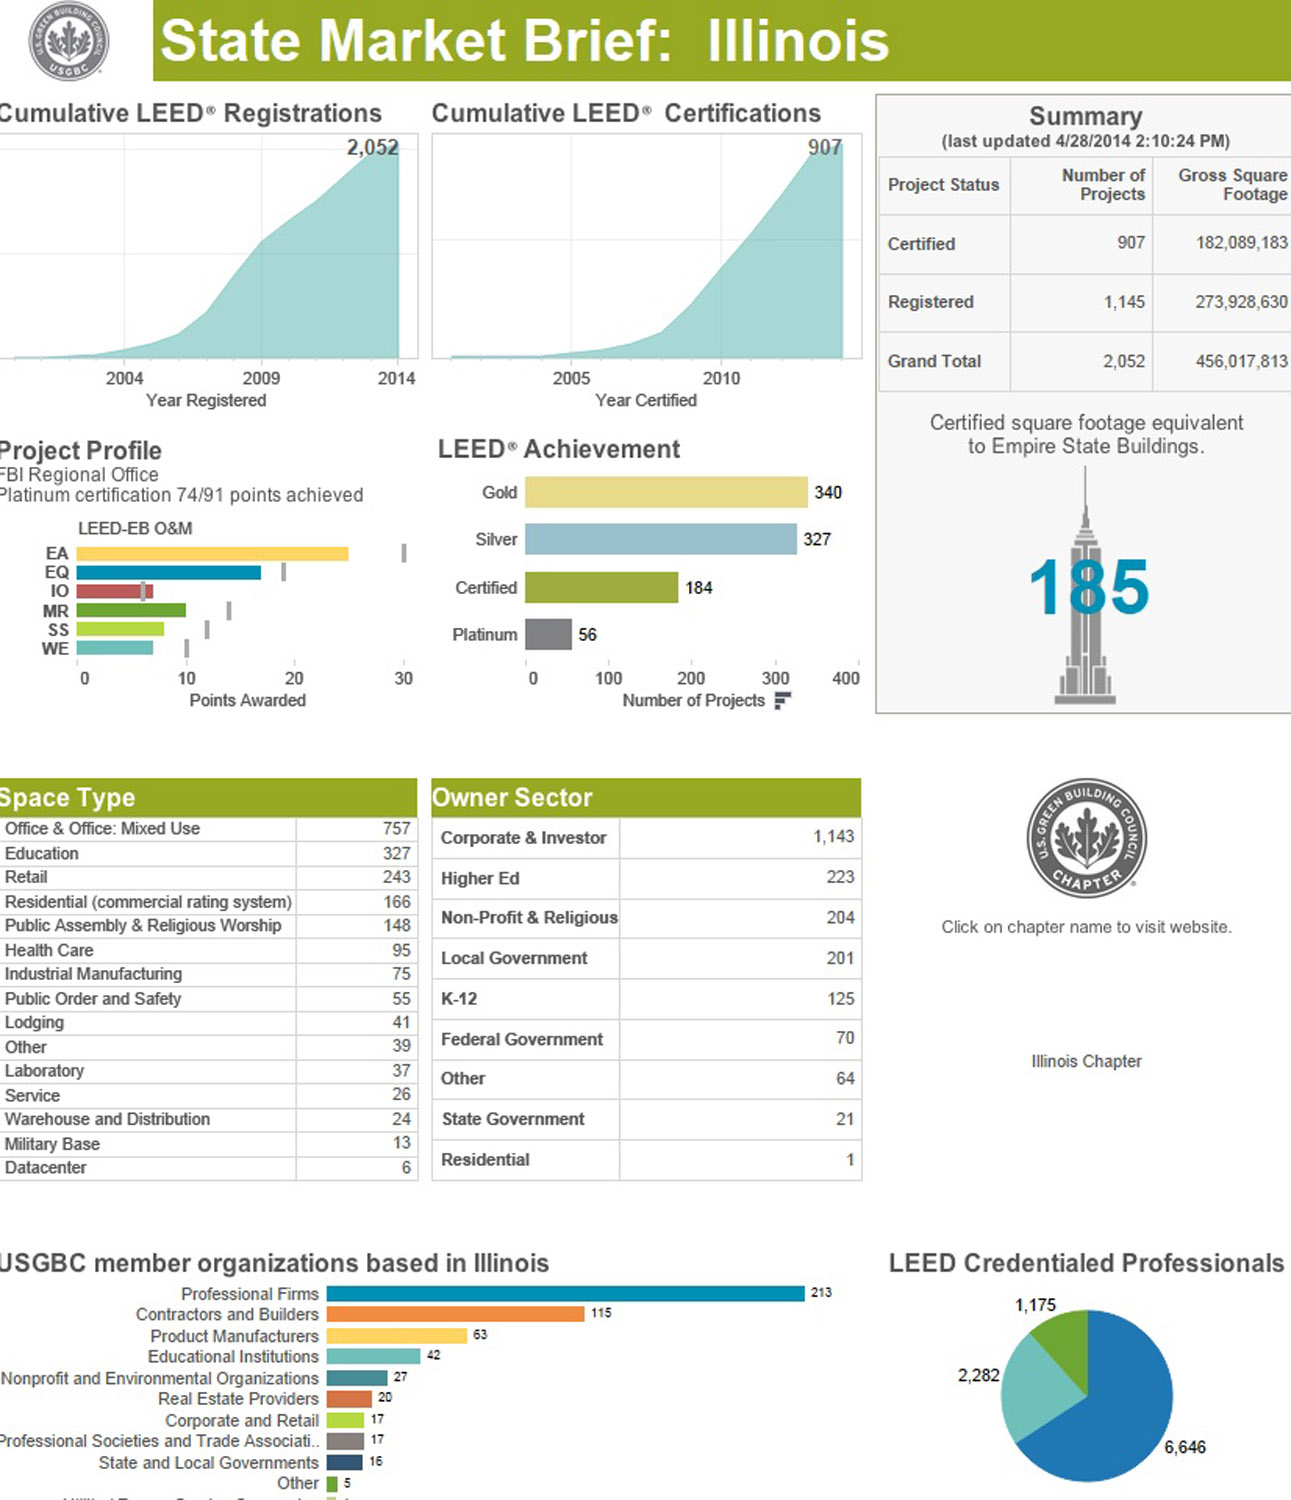
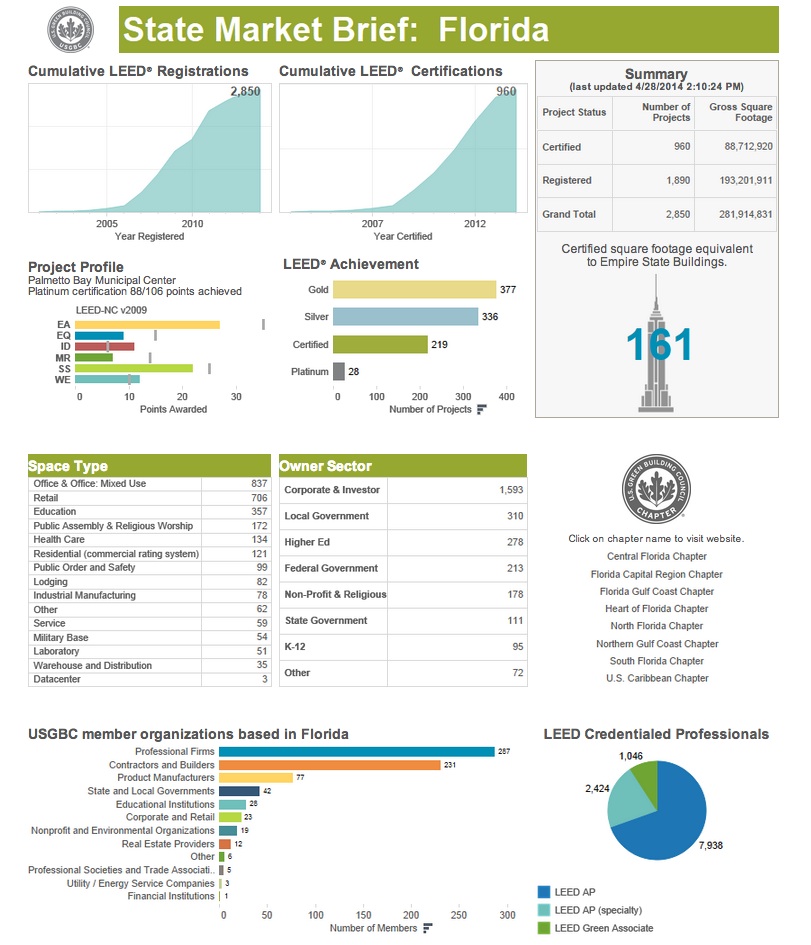
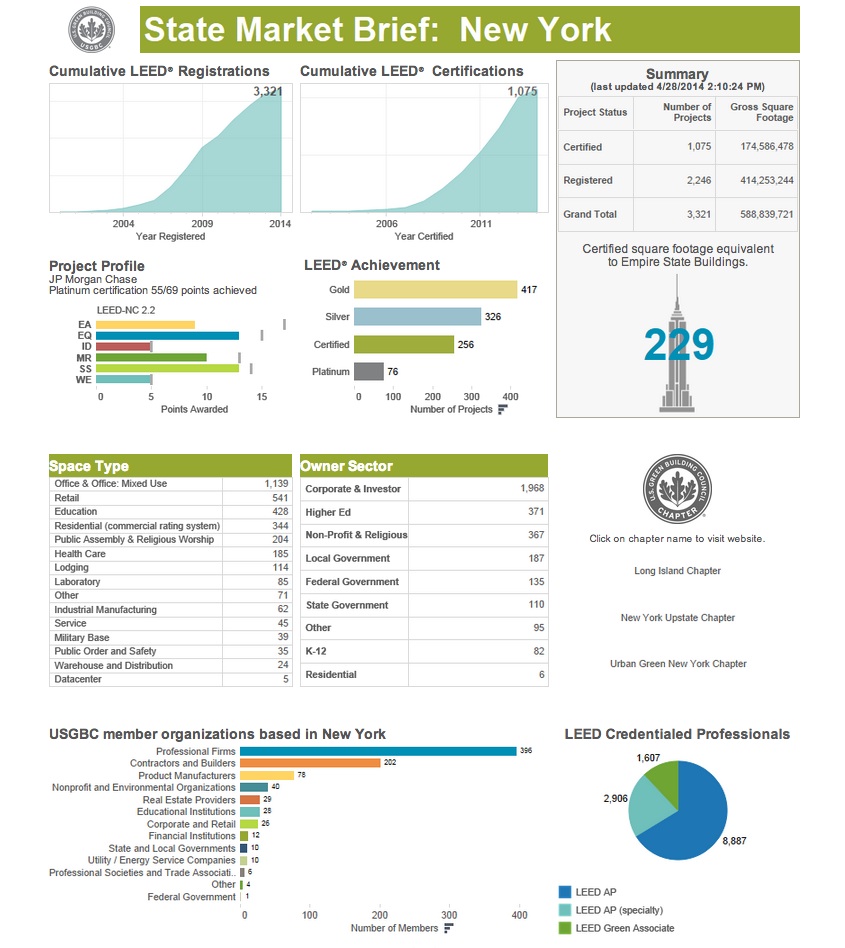
The market briefs highlight data on cumulative LEED-registered and -certified projects, gross square footage of LEED-registered and -certified space, project totals broken out by owner type and space type, USGBC member organizations by type, LEED professional credential holders, links to chapter(s) serving that state, as well as a project profile scorecard.
"Our state-level market briefs demonstrate USGBC’s commitment to data and information transparency at an important level of granularity. You can’t find this data anywhere else in the market,” said Mahesh Ramanujam, chief operating officer, USGBC. "The choice to build green buildings is simple. These state-level data visualizations make it even simpler."
The state market briefs can be downloaded either as a visualization or as a raw data file and are accessible at USGBC.org/advocacy/market-brief.
Here are screen captures of the dashboards for California, Florida, and New York:
Related Stories
| Dec 15, 2014
HOK-designed Anaheim Regional transit hub opens, expected to serve three million per year
ARTIC’s flexible design ensures that it can serve as a southern terminus for California’s future high-speed rail system.
| Dec 8, 2014
Moshe Safdie wants to reinvent airports with Jewel Changi Airport addition
A new addition to Singapore's Changi Airport, designed by Moshe Safdie, will feature a waterfall and extensive indoor gardens.
| Nov 19, 2014
The evolution of airport design and construction [infographic]
Safety, consumer demand, and the new economics of flight are three of the major factors shaping how airlines and airport officials are approaching the need for upgrades and renovations, writes Skanska USA's MacAdam Glinn.
| Nov 18, 2014
Grimshaw releases newest designs for world’s largest airport
The airport is expected to serve 90 million passengers a year on the opening of the first phase, and more than 150 million annually after project completion in 2018.
| Nov 14, 2014
JetBlue opens Gensler-designed International Concourse at JFK
The 175,000-sf extension includes the conversion of three existing gates to international swing gates, and the addition of three new international swing gates.
Sponsored | | Nov 12, 2014
Eye-popping façade highlights renovation, addition at Chaffin Junior High School
The new distinctive main entrance accentuates the public face of the school with an aluminum tube “baguette” system.
| Oct 26, 2014
New York initiates design competition for upgrading LaGuardia, Kennedy airports
New York Gov. Andrew Cuomo said that the state would open design competitions to fix and upgrade New York City’s aging airports. But financing construction is still unsettled.
| Oct 16, 2014
Perkins+Will white paper examines alternatives to flame retardant building materials
The white paper includes a list of 193 flame retardants, including 29 discovered in building and household products, 50 found in the indoor environment, and 33 in human blood, milk, and tissues.
| Oct 12, 2014
AIA 2030 commitment: Five years on, are we any closer to net-zero?
This year marks the fifth anniversary of the American Institute of Architects’ effort to have architecture firms voluntarily pledge net-zero energy design for all their buildings by 2030.
| Sep 24, 2014
Architecture billings see continued strength, led by institutional sector
On the heels of recording its strongest pace of growth since 2007, there continues to be an increasing level of demand for design services signaled in the latest Architecture Billings Index.


