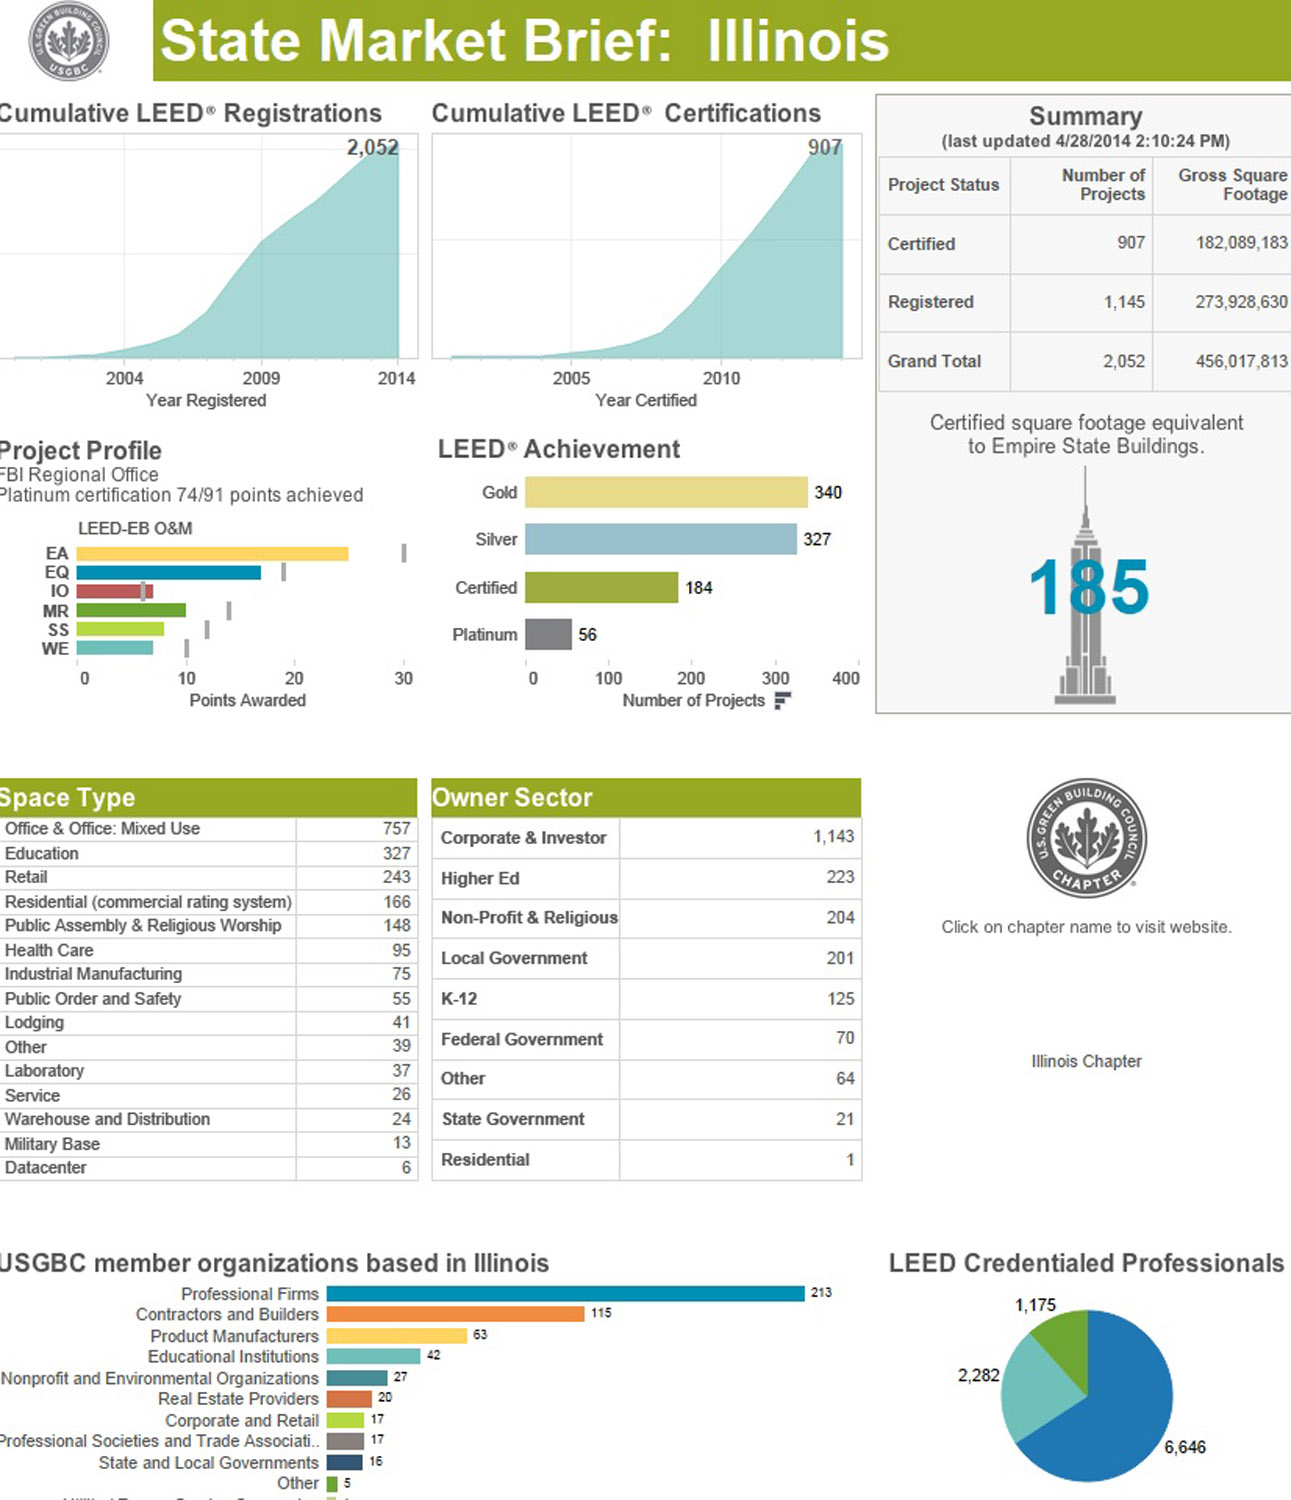
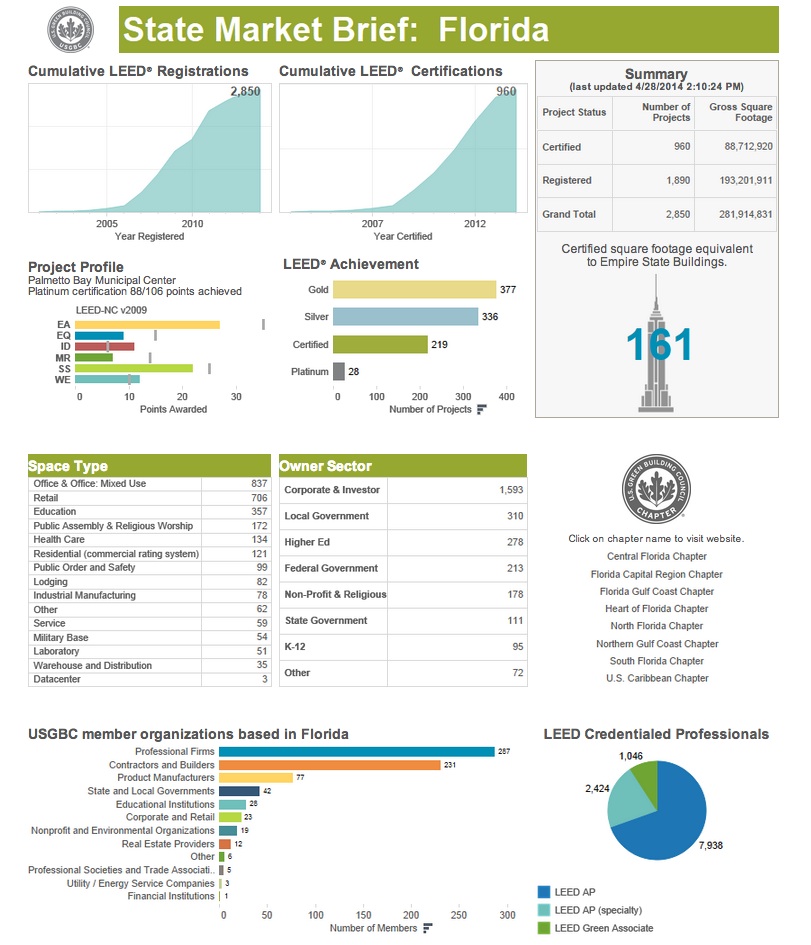
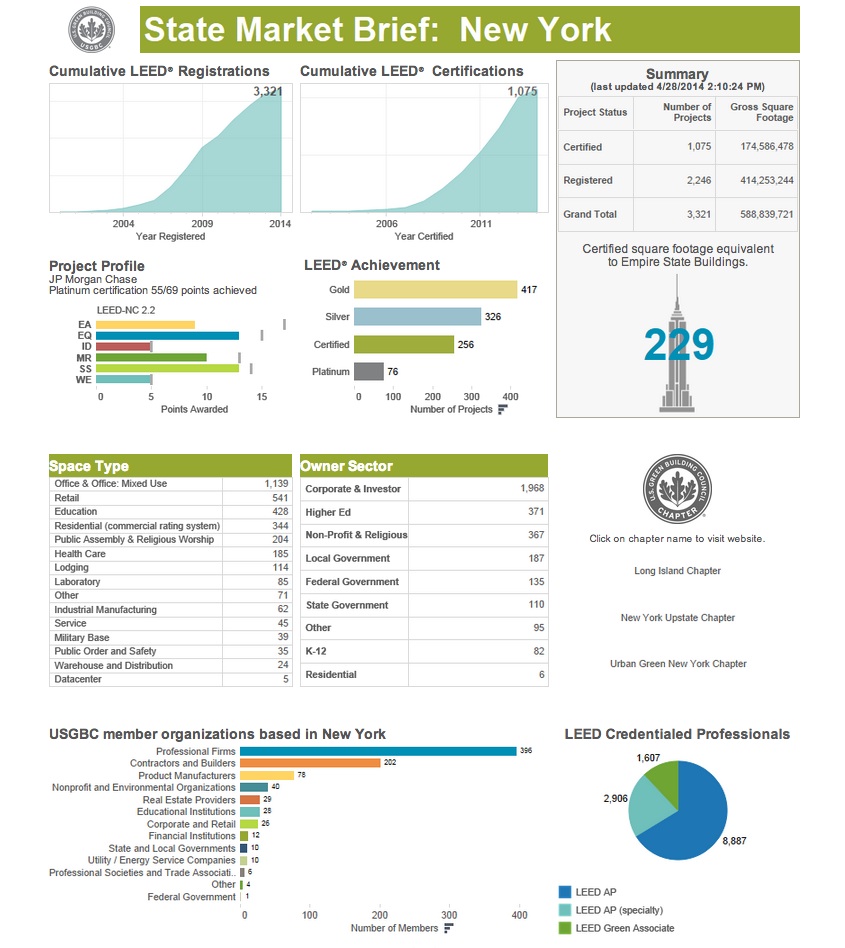
The U.S. Green Building Council last week launched an online data visualization resource that highlights real-time green building data for each state in the U.S. and Washington, D.C.
The enhanced state market briefs—which highlight LEED projects, LEED-credentialed professionals, and USGBC membership in each state—provide green building advocates and the general public a look into LEED’s impact within any U.S. state.
The market briefs were created to supply green building advocates with on-the-ground information to tell robust stories about the multifaceted benefits of LEED green buildings. Each market brief acts as a state-level barometer of economic activity taking place in the green building industry.
Market briefs for countries outside the U.S. are available upon request, and LEED for Homes and LEED for Neighborhood Development data and projects will be added later this year.
The market briefs highlight data on cumulative LEED-registered and -certified projects, gross square footage of LEED-registered and -certified space, project totals broken out by owner type and space type, USGBC member organizations by type, LEED professional credential holders, links to chapter(s) serving that state, as well as a project profile scorecard.
"Our state-level market briefs demonstrate USGBC’s commitment to data and information transparency at an important level of granularity. You can’t find this data anywhere else in the market,” said Mahesh Ramanujam, chief operating officer, USGBC. "The choice to build green buildings is simple. These state-level data visualizations make it even simpler."
The state market briefs can be downloaded either as a visualization or as a raw data file and are accessible at USGBC.org/advocacy/market-brief.
Here are screen captures of the dashboards for California, Florida, and New York:
Related Stories
| Aug 22, 2013
Energy-efficient glazing technology [AIA Course]
This course discuses the latest technological advances in glazing, which make possible ever more efficient enclosures with ever greater glazed area.
| Aug 21, 2013
Why research is the ticket to successful airport wayfinding
Wayfinding is more than just signs; it requires a holistic approach based on communicating information that helps people make the right decision at the right time.
| Aug 19, 2013
Discovery of hidden asbestos complicates DFW terminal renovations
The finding of more asbestos in Terminal B than expected, and the pending merger of US Airways and the airport’s largest tenant, American Airlines, is causing construction delays on a $2.3 billion Dallas/Fort Worth Airport terminal renovation.
| Aug 19, 2013
Integration of solar panels in building skin seen as key net-zero element
Recent high-profile projects, including stadiums in Brazil for the upcoming World Cup and Summer Olympics and a bank headquarters in the U.K., reflect an effort by designers to adopt building-integrated photovoltaics, or BIPV.
| Aug 14, 2013
Green Building Report [2013 Giants 300 Report]
Building Design+Construction's rankings of the nation's largest green design and construction firms.
| Jul 29, 2013
2013 Giants 300 Report
The editors of Building Design+Construction magazine present the findings of the annual Giants 300 Report, which ranks the leading firms in the AEC industry.
| Jul 22, 2013
Transportation Facility Report [2013 Giants 300 Report]
Building Design+Construction's rankings of design and construction firms with the most revenue from airport terminals and other transportation-related facilities, as reported in the 2013 Giants 300 Report.
| Jul 19, 2013
Renovation, adaptive reuse stay strong, providing fertile ground for growth [2013 Giants 300 Report]
Increasingly, owners recognize that existing buildings represent a considerable resource in embodied energy, which can often be leveraged for lower front-end costs and a faster turnaround than new construction.
| Jul 18, 2013
Top Local Government Sector Construction Firms [2013 Giants 300 Report]
Turner, Clark Group, PCL top Building Design+Construction's 2013 ranking of the largest local government sector contractor and construction management firms in the U.S.
| Jul 18, 2013
Top Local Government Sector Engineering Firms [2013 Giants 300 Report]
STV, URS, AECOM top Building Design+Construction's 2013 ranking of the largest local government sector engineering and engineering/architecture firms in the U.S.


