

Most older Americans don’t reside in “livable” communities that combine safety, security and affordability with appropriate housing and transportation options, and supportive features and services that enhance personal independence, allow residents to remain in their homes as they age, and foster residents’ engagement in civic, economic, and social life.
In a 33-page paper titled “Which Older Adults Have Access to America’s Most Livable Neighborhoods,” the Joint Center for Housing Studies at Harvard University and AARP’s Public Policy Institute draw upon information from the 2017 American Communities Survey (ACS)—whose estimates categorize 217,739 Census neighborhood block groups—as a guide to analyze AARP’s 2018 Livability Index, an online interactive source that scores neighborhoods across the U.S. to shed light on the current livability of a given location and to highlight opportunities for improvement.
The Index derives from more than 4,500 questionnaire respondents and 80 in-depth interviews, as well as input from 30 experts in various fields.
The paper also used ACS microdata to examine profiles of older adults residing in neighborhoods with different levels of livability to suggest opportunities for addressing inequality in access to livable communities, and to the specific elements certain populations lack even in the most livable places.
The paper’s goal is to evaluate whether access to livable communities is evenly distributed across the older adult population, to assess how older adults access livability features, and to understand the characteristics of higher performing communities.
DISCONNECT BETWEEN WHERE PEOPLE LIVE AND WHAT THEY NEED
Some key findings:
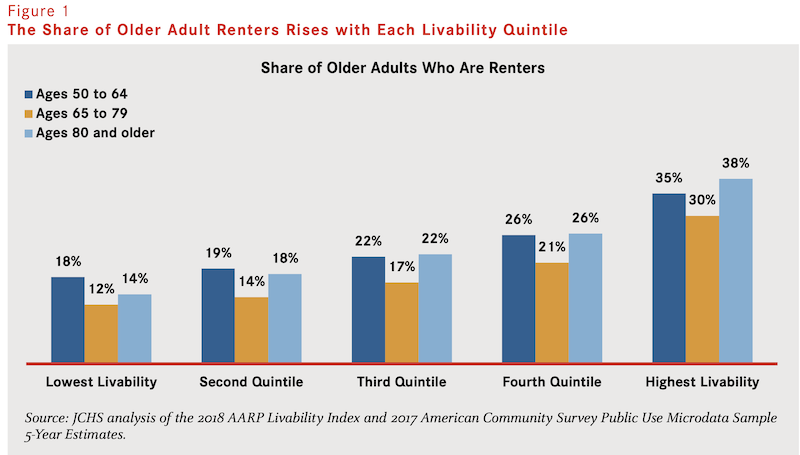
•Nearly 146 million Americans of all ages live in neighborhoods at the bottom two quintiles in terms of livability. And older adults are underrepresented in most livable communities; in the least livable quintile, adults age 55 or older made up near one-third of residents.
•Older adults who move tend to relocate to newer places with similar levels of overall livability as their previous neighborhoods. Only 11% move to more livable locations, and 14% actually move to neighborhoods with lower livability scores.
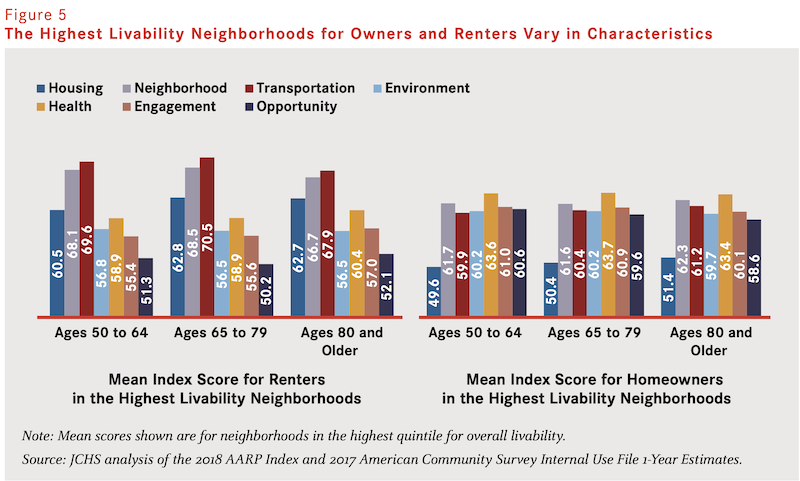
•There is a relationship between different types of livable neighborhoods and income, race/ethnicity characteristics, and homeownership. “At every level of livability, homeownership and income play important roles in accessing features that contribute to high scores in specific livability categories,” the paper’s authors write.
Certain themes also emerged from this research:
•Livability gap. There is a disconnect between what people have and what they need in communities to age in place.
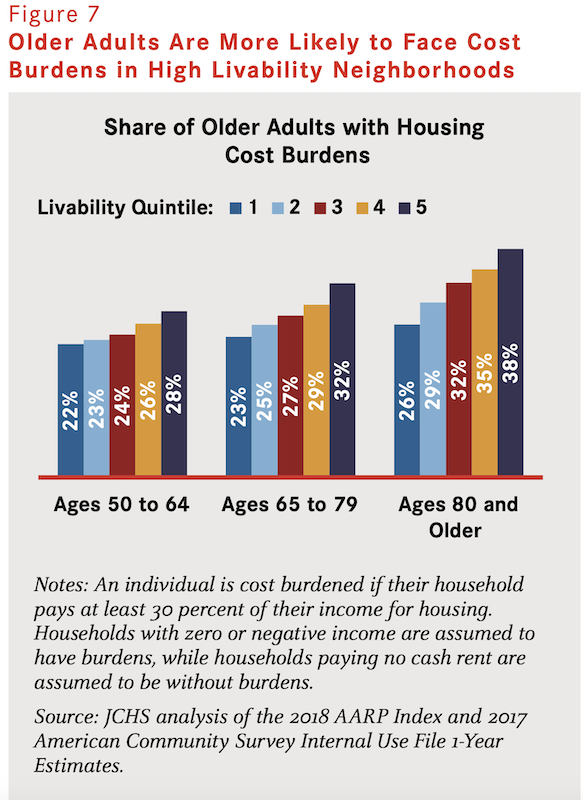
•Housing affordability. Communities that score higher on the Index tend to have higher housing costs. High housing costs can create obstacles to accessing the benefits livable communities can provide.
•Disparities in access to specific livability features. People of color, people with disabilities, and people with lower incomes may not have access to amenities and services that support aging. As the analysis shows, even when living in high scoring communities these groups may not have access to amenities and services related to health, engagement, and opportunity.
•Mobility. People tend to move to places with similar livability levels as their previous neighborhood.
•Neighborhood preferences and location choice. Individual preferences, barriers, and available community amenities may impact people’s decisions on where to live.
POLICY SUGGESTIONS INCLUDE PROMOTING HEALTHIER ENVIRONMENTS
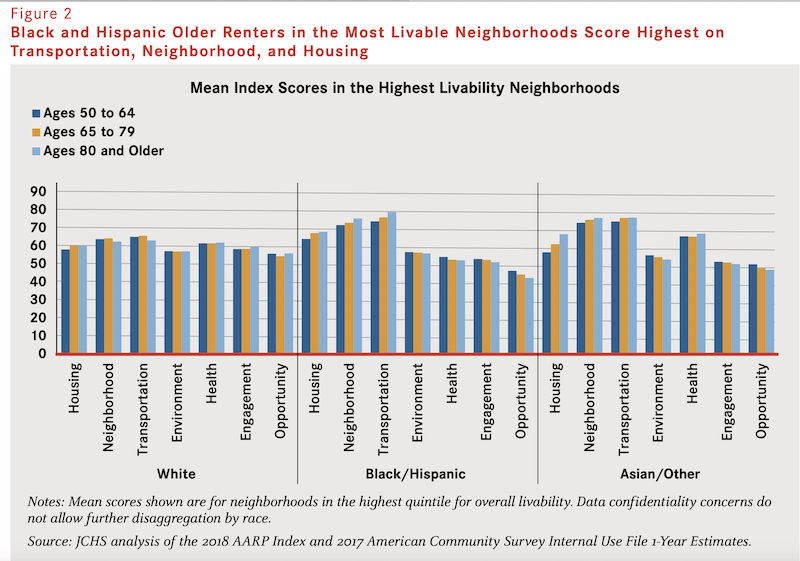
Livable communities tend to have diverse housing types that include more single-person households, where older adults are more likely to reside. This factor might explain why, on average, older renters live in more livable places than do older owners.
The likelihood of living in livable communities shifts somewhat with the person’s age. Among older adults, those ages 50 to 64 as well as those ages 80 and older have a slightly better chance of living in a high livability neighborhood than do those ages 65 to 79. Among those ages 80 and older, 18 percent reside in the top quintile neighborhoods but only 16 percent of those ages 65 to 79 do. In contrast, those ages 65 to 79 are more likely than other age groups to live in lower-livability neighborhoods.
The paper offers policy recommendations that focus on housing affordability and access, creating save neighborhoods that have ample food and culture available, environments that promote healthy, clean and natural places to live; and communities that supporting resident well-being and social lives, and enable economic and educational pursuits.
“By analyzing the Index in conjunction with Census block group data from the ACS, we have revealed specific areas that warrant focused attention,” the paper states. “Housing stock, tenure, and affordability have particular influences on the access older adults have to the most livable communities.” While this analysis could not reveal if the most vulnerable older people residing in livable communities have equal access to every feature, service, and amenity, “one expects they do not.”
Related Stories

Market Data | May 2, 2018
Construction employment increases in 245 metro areas between March 2017 & 2018, as trade fights & infrastructure funding shortfalls loom
Houston-The Woodlands-Sugar Land, Texas and Weirton-Steubenville, W.Va.-Ohio experience largest year-over-year gains; Baton Rouge, La. and Auburn-Opelika, Ala. have biggest annual declines.

Market Data | May 2, 2018
Nonresidential Construction down in March, private sector falters, public sector unchanged
February’s spending estimate was revised roughly $10 billion higher.

Market Data | Apr 30, 2018
Outlook mixed for renewable energy installations in Middle East and Africa region
Several major MEA countries are actively supporting the growth of renewable energy.
Market Data | Apr 12, 2018
Construction costs climb in March as wide range of input costs jump
Association officials urge Trump administration, congress to fund infrastructure adequately as better way to stimulate demand than tariffs that impose steep costs on contractors and project owners.

Market Data | Apr 9, 2018
Construction employers add 228,000 jobs over the year despite dip in March
Average hourly earnings increase to $29.43 in construction, topping private sector by nearly 10%; Association officials urge updating and better funding programs to train workers for construction jobs.

Market Data | Apr 4, 2018
Construction employment increases in 257 metro areas between February 2017 & 2018 as construction firms continue to expand amid strong demand
Riverside-San Bernardino-Ontario, Calif. and Merced, Calif. experience largest year-over-year gains; Baton Rouge, La. and Auburn-Opelika, Ala. have biggest annual declines in construction employment.
Market Data | Apr 2, 2018
Construction spending in February inches up from January
Association officials urge federal, state and local officials to work quickly to put recently enacted funding increases to work to improve aging and over-burdened infrastructure, offset public-sector spending drops.

Market Data | Mar 29, 2018
AIA and the University of Minnesota partner to develop Guides for Equitable Practice
The Guides for Equitable Practice will be developed and implemented in three phase.

Market Data | Mar 22, 2018
Architecture billings continue to hold positive in 2018
Billings particularly strong at firms in the West and Midwest regions.

Market Data | Mar 21, 2018
Construction employment increases in 248 metro areas as new metal tariffs threaten future sector job gains
Riverside-San Bernardino-Ontario, Calif., and Merced, Calif., experience largest year-over-year gains; Baton Rouge, La., and Auburn-Opelika, Ala., have biggest annual declines in construction employment.


