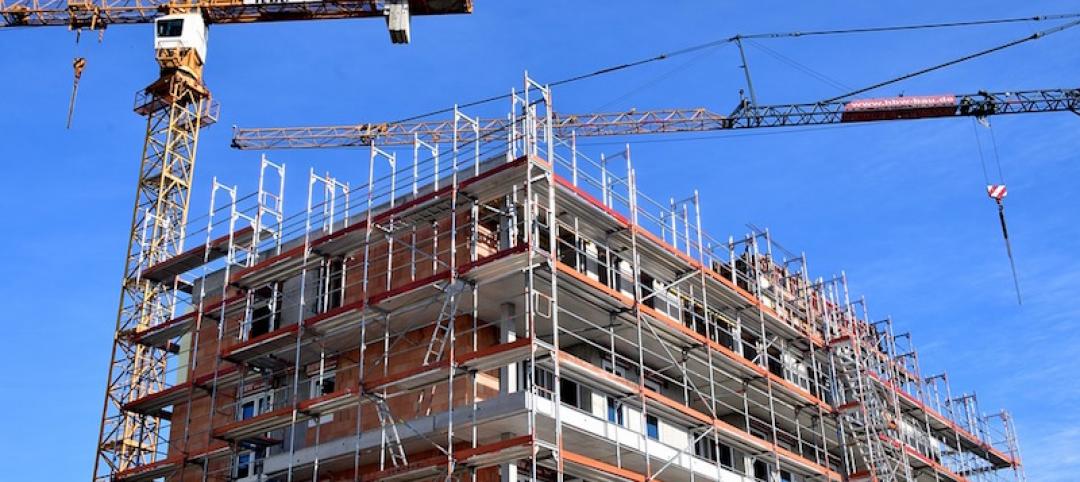
At the end of 2018, analysts at Lodging Econometrics (LE) reported that the total U.S. construction pipeline continued to trend upward with 5,530 projects/669,456 rooms, both up a strong 7% year-over-year (YOY). However, pipeline totals continue to trail the all-time high of 5,883 projects/785,547 rooms reached in the second quarter of 2008.
Project counts in the early planning stage continue to rise reaching an all-time high of 1,723 projects/199,326 rooms, up 14% by projects and 12% by rooms YOY. Projects scheduled to start construction in the next 12 months stand at 2,153 projects/255,083 rooms. Projects currently under construction are at 1,654 projects/215,047 rooms, the highest counts since early 2008.
Also noteworthy at year-end, the upscale, upper-midscale, and midscale categories are at record-highs, for both rooms and projects. Luxury room counts and upper-upscale project counts are also at record levels.
In 2018, the U.S. had 947 new hotels/112,050 rooms open, a 2% growth in new supply, bringing the total U.S. census to 56,909 hotels/5,381,090 rooms. The LE forecast for new hotel openings in 2019 anticipates a 2.2% supply growth rate with 1,022 new hotels/116,357 rooms expected to open. The pace for new hotel openings has slowed slightly because of construction delays largely caused by shortages in skilled labor.
Lending at attractive rates is still accessible to developers, but lenders are growing more selective as we move deeper into the existing cycle.
The pipeline has completed its seventh consecutive year of growth. Moving forward the growth rate is expected to slow as the economies of most countries, including the United States, more firmly settle into the “new normal" marked by slow growth and low inflation.
While there are no visible signs of a recession on the horizon, the risks to the economy are not insignificant and include tariff conflicts, swings in the stock market, unforeseen geopolitical problems, any of which could send the economy lower.
Related Stories
Market Data | May 2, 2018
Construction employment increases in 245 metro areas between March 2017 & 2018, as trade fights & infrastructure funding shortfalls loom
Houston-The Woodlands-Sugar Land, Texas and Weirton-Steubenville, W.Va.-Ohio experience largest year-over-year gains; Baton Rouge, La. and Auburn-Opelika, Ala. have biggest annual declines.
Market Data | May 2, 2018
Nonresidential Construction down in March, private sector falters, public sector unchanged
February’s spending estimate was revised roughly $10 billion higher.
Market Data | Apr 30, 2018
Outlook mixed for renewable energy installations in Middle East and Africa region
Several major MEA countries are actively supporting the growth of renewable energy.
Market Data | Apr 12, 2018
Construction costs climb in March as wide range of input costs jump
Association officials urge Trump administration, congress to fund infrastructure adequately as better way to stimulate demand than tariffs that impose steep costs on contractors and project owners.
Market Data | Apr 9, 2018
Construction employers add 228,000 jobs over the year despite dip in March
Average hourly earnings increase to $29.43 in construction, topping private sector by nearly 10%; Association officials urge updating and better funding programs to train workers for construction jobs.
Market Data | Apr 4, 2018
Construction employment increases in 257 metro areas between February 2017 & 2018 as construction firms continue to expand amid strong demand
Riverside-San Bernardino-Ontario, Calif. and Merced, Calif. experience largest year-over-year gains; Baton Rouge, La. and Auburn-Opelika, Ala. have biggest annual declines in construction employment.
Market Data | Apr 2, 2018
Construction spending in February inches up from January
Association officials urge federal, state and local officials to work quickly to put recently enacted funding increases to work to improve aging and over-burdened infrastructure, offset public-sector spending drops.
Market Data | Mar 29, 2018
AIA and the University of Minnesota partner to develop Guides for Equitable Practice
The Guides for Equitable Practice will be developed and implemented in three phase.
Market Data | Mar 22, 2018
Architecture billings continue to hold positive in 2018
Billings particularly strong at firms in the West and Midwest regions.
Market Data | Mar 21, 2018
Construction employment increases in 248 metro areas as new metal tariffs threaten future sector job gains
Riverside-San Bernardino-Ontario, Calif., and Merced, Calif., experience largest year-over-year gains; Baton Rouge, La., and Auburn-Opelika, Ala., have biggest annual declines in construction employment.


