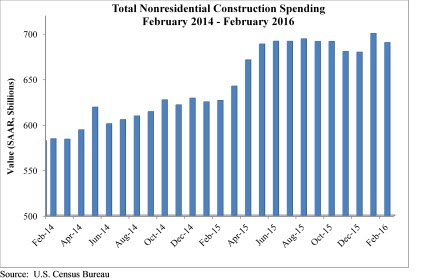
Nonresidential construction spending dipped in February, falling 1.4% on a monthly basis according to analysis of U.S. Census Bureau data released by Associated Builders and Contractors (ABC).
Spending in the nonresidential sector totaled $690.3 billion on a seasonally adjusted, annualized basis in February. While this represents a step back from January's figure of $700.3 billion (revised down from $701.9 billion), it is still 1.5% higher than the level of spending registered in December 2015 and 10.1% higher than February 2015.
"February's weather was particularly harsh in certain parts of the country, including in the economic activity-rich Mid-Atlantic region, and that appears to have had an undue effect on construction spending data," ABC Chief Economist Anirban Basu said. "February data are always difficult to interpret, and the latest nonresidential construction spending figures are no different. Seasonal factors have also made state-level data very difficult to interpret.
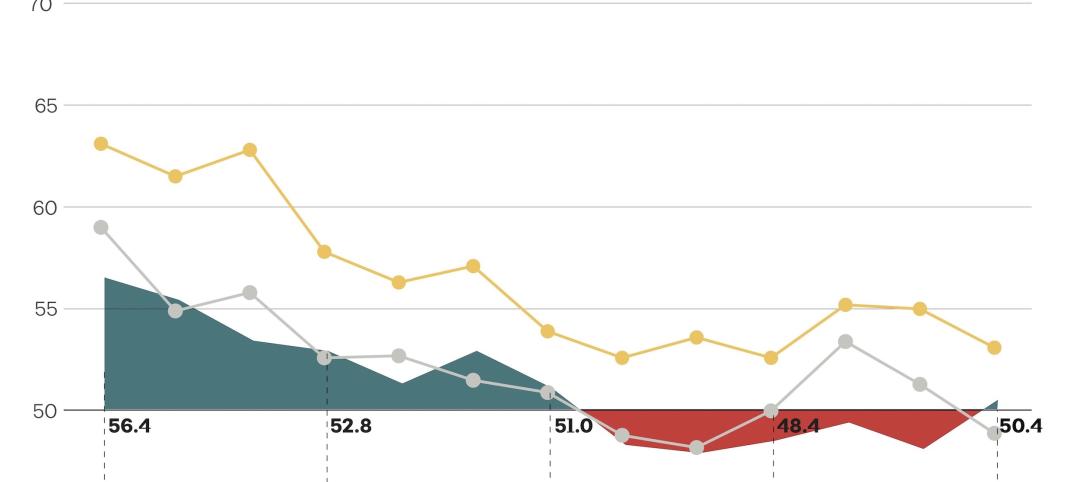
"Beyond meteorological considerations, there are other reasons not to be alarmed by February's decline in nonresidential construction spending," Basu said. "Today's positive construction employment report indicates continued economic growth. Moreover, much of the decline in volume was attributable to manufacturing, but the ISM manufacturing index recently crossed the threshold 50 level, indicating that domestic manufacturing is now expanding for the first time in seven months."
Eight of the 16 nonresidential subsectors experienced spending decreases in February, though almost half of the total decline in spending is attributable to the 5.9% decline in manufacturing-related spending.
The following 16 nonresidential construction sectors experienced spending increases in February on a monthly basis:
- Spending in the amusement and recreation category climbed 0.4% from January and is up 13.7% from February 2015.
- Lodging-related spending is up 0.4% for the month and is up 30.1% on a year-ago basis.
- Water supply-related spending expanded 1.9% on a monthly basis and 3.2% on a yearly basis.
- Spending in the office category grew 3.8% from January and is up 25.3% on a year-ago basis.
- Transportation-related spending expanded 0.5% month-over-month and 5.8% year-over-year.
- Health care-related spending expanded 2% from January and is up 3.3% from February 2015.
- Public safety-related spending is up 1.8% for the month, but is down 5.3% for the year.
- Commercial-related construction spending inched 0.1% higher for the month and grew 11% for the year.
Spending in eight of the nonresidential construction subsectors fell in February on a monthly basis:
- Educational-related construction spending fell 2.4% from January, but has expanded 8.5% on a yearly basis.
- Communication-related spending fell 15% month-over-month, but expanded 11.8% year-over-year.
- Spending in the highway and street category fell 2% from January, but is 24.5 higher than one year ago.
- Sewage and waste disposal-related spending fell 2.4% for the month, but is up 2.3% for the year.
- Conservation and development-related spending is 4.6% lower on a monthly basis and 16.8% lower on a year-over-year basis.
- Spending in the religious category fell 4% for the month and is up just 0.7% for the year.
- Manufacturing-related spending fell 5.9% on a monthly basis and is up only 0.8% on a yearly basis.
- Spending in the power category fell 0.6% from January, but is 4.8% higher than one year ago.
Related Stories
Market Data | May 2, 2023
Nonresidential construction spending up 0.7% in March 2023 versus previous month
National nonresidential construction spending increased by 0.7% in March, according to an Associated Builders and Contractors analysis of data published today by the U.S. Census Bureau. On a seasonally adjusted annualized basis, nonresidential spending totaled $997.1 billion for the month.
Hotel Facilities | May 2, 2023
U.S. hotel construction up 9% in the first quarter of 2023, led by Marriott and Hilton
In the latest United States Construction Pipeline Trend Report from Lodging Econometrics (LE), analysts report that construction pipeline projects in the U.S. continue to increase, standing at 5,545 projects/658,207 rooms at the close of Q1 2023. Up 9% by both projects and rooms year-over-year (YOY); project totals at Q1 ‘23 are just 338 projects, or 5.7%, behind the all-time high of 5,883 projects recorded in Q2 2008.
Market Data | May 1, 2023
AEC firm proposal activity rebounds in the first quarter of 2023: PSMJ report
Proposal activity for architecture, engineering and construction (A/E/C) firms increased significantly in the 1st Quarter of 2023, according to PSMJ’s Quarterly Market Forecast (QMF) survey. The predictive measure of the industry’s health rebounded to a net plus/minus index (NPMI) of 32.8 in the first three months of the year.
Industry Research | Apr 25, 2023
The commercial real estate sector shouldn’t panic (yet) about recent bank failures
A new Cushman & Wakefield report depicts a “well capitalized” banking industry that is responding assertively to isolated weaknesses, but is also tightening its lending.
Architects | Apr 21, 2023
Architecture billings improve slightly in March
Architecture firms reported a modest increase in March billings. This positive news was tempered by a slight decrease in new design contracts according to a new report released today from The American Institute of Architects (AIA). March was the first time since last September in which billings improved.
Contractors | Apr 19, 2023
Rising labor, material prices cost subcontractors $97 billion in unplanned expenses
Subcontractors continue to bear the brunt of rising input costs for materials and labor, according to a survey of nearly 900 commercial construction professionals.
Data Centers | Apr 14, 2023
JLL's data center outlook: Cloud computing, AI driving exponential growth for data center industry
According to JLL’s new Global Data Center Outlook, the mass adoption of cloud computing and artificial intelligence (AI) is driving exponential growth for the data center industry, with hyperscale and edge computing leading investor demand.
Healthcare Facilities | Apr 13, 2023
Healthcare construction costs for 2023
Data from Gordian breaks down the average cost per square foot for a three-story hospital across 10 U.S. cities.
Higher Education | Apr 13, 2023
Higher education construction costs for 2023
Fresh data from Gordian breaks down the average cost per square foot for a two-story college classroom building across 10 U.S. cities.
Market Data | Apr 13, 2023
Construction input prices down year-over-year for first time since August 2020
Construction input prices increased 0.2% in March, according to an Associated Builders and Contractors analysis of U.S. Bureau of Labor Statistics Producer Price Index data released today. Nonresidential construction input prices rose 0.4% for the month.


