Associated Builders and Contractors reports today that its Construction Backlog Indicator increased to nine months in May from 8.8 months in April, according to an ABC member survey conducted May 17 to June 3. The reading is up one month from May 2021.
View ABC’s Construction Backlog Indicator and Construction Confidence Index tables for May 2022.
Backlog in the infrastructure segment jumped from 8.7 months in April to 9.3 months in May, and the Northeast and South regions continue to outperform the Middle States and the West. Contractors with more than $100 million in annual revenues enjoyed the highest backlog, at 13.2 months.
ABC’s Construction Confidence Index readings for sales, profit margins and staffing levels declined in May. The indices for sales and staffing remain above the threshold of 50, indicating expectations of growth over the next six months, while the reading for profit margins was exactly 50 for the month.
“It is simply remarkable that contractors continue to add to backlog amidst global strife, rising materials prices and ubiquitous labor force challenges,” said ABC Chief Economist Anirban Basu. “Backlog is up in every segment over the past year, including in the somewhat shaky commercial category. The largest increase in backlog has been registered in the industrial segment. More American companies are committing to place additional supply chain capacity in the United States, with Intel and Ford representing particularly recent and noteworthy examples.
“For contractors, the challenge will continue to be the cost of delivering construction services,” said Basu. “The risk of severe increases in costs and substantial delays in delivery remains elevated given the volatility in input prices, the propensity of the labor force to shift jobs in large numbers and equipment shortages and delays. This ABC survey indicates that the proportion of contractors who expect that profit margins will expand over the next six months is declining, a reflection of lingering, worsening supply chain challenges.”
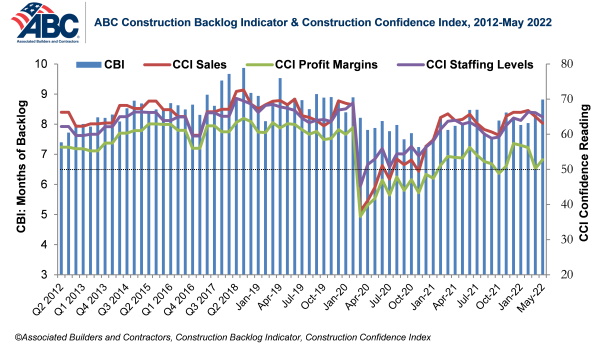
Note: The reference months for the Construction Backlog Indicator and Construction Confidence Index data series were revised on May 12, 2020, to better reflect the survey period. CBI quantifies the previous month’s work under contract based on the latest financials available, while CCI measures contractors’ outlook for the next six months.
Related Stories
Market Data | Mar 29, 2017
Contractor confidence ends 2016 down but still in positive territory
Although all three diffusion indices in the survey fell by more than five points they remain well above the threshold of 50, which signals that construction activity will continue to be one of the few significant drivers of economic growth.
Market Data | Mar 24, 2017
These are the most and least innovative states for 2017
Connecticut, Virginia, and Maryland are all in the top 10 most innovative states, but none of them were able to claim the number one spot.
Market Data | Mar 22, 2017
After a strong year, construction industry anxious about Washington’s proposed policy shifts
Impacts on labor and materials costs at issue, according to latest JLL report.
Market Data | Mar 22, 2017
Architecture Billings Index rebounds into positive territory
Business conditions projected to solidify moving into the spring and summer.
Market Data | Mar 15, 2017
ABC's Construction Backlog Indicator fell to end 2016
Contractors in each segment surveyed all saw lower backlog during the fourth quarter, with firms in the heavy industrial segment experiencing the largest drop.
Market Data | Feb 28, 2017
Leopardo’s 2017 Construction Economics Report shows year-over-year construction spending increase of 4.2%
The pace of growth was slower than in 2015, however.
Market Data | Feb 23, 2017
Entering 2017, architecture billings slip modestly
Despite minor slowdown in overall billings, commercial/ industrial and institutional sectors post strongest gains in over 12 months.
Market Data | Feb 16, 2017
How does your hospital stack up? Grumman/Butkus Associates 2016 Hospital Benchmarking Survey
Report examines electricity, fossil fuel, water/sewer, and carbon footprint.
Market Data | Feb 1, 2017
Nonresidential spending falters slightly to end 2016
Nonresidential spending decreased from $713.1 billion in November to $708.2 billion in December.
Market Data | Jan 31, 2017
AIA foresees nonres building spending increasing, but at a slower pace than in 2016
Expects another double-digit growth year for office construction, but a more modest uptick for health-related building.


