On the heels of recording its strongest pace of growth since 2007, there continues to be an increasing level of demand for design services signaled in the latest Architecture Billings Index (ABI).
The American Institute of Architects (AIA) reported the August ABI score was 53.0, down from a mark of 55.8 in July. This score reflects an increase in design activity (any score above 50 indicates an increase in billings). The new projects inquiry index was 62.6, following a very strong mark of 66.0 the previous month.
As a leading economic indicator of construction activity, the ABI reflects the approximate nine to twelve month lead time between architecture billings and construction spending.
The AIA has added a new indicator measuring the trends in new design contracts at architecture firms that can provide a strong signal of the direction of future architecture billings. The score for design contracts in August was 56.9.
“One of the key triggers for accelerating growth at architecture firms is that long-stalled construction projects are starting to come back to life in many areas across the country,” said AIA Chief Economist Kermit Baker, Hon. AIA, PhD. “Long awaited access to credit from lending institutions and an increasing comfort level in the overall economy has helped revitalize the commercial real estate sector in recent months. Additionally, though, a crucial component to a broader industry-wide recovery is the emerging demand for new projects such as education facilities, government buildings and, in some cases, hospitals.”
In a separate query to ABI panelists, 76% of architecture firms indicated that they had major design projects that were delayed or cancelled for economic/financing reasons during the past construction downturn. Almost one-third of those firms have reported that a previously stalled project has come back to life and resulted in firm billings. Breakdown by project type:
• Mixed-use - 39%
• Institutional - 33%
• Commercial/Industrial - 31%
• Residential - 26%
Key August ABI highlights:
• Regional averages: Northeast (58.1) , South (55.1), West (52.5), Midwest (51.0)
• Sector index breakdown: multi-family residential (58.1), mixed practice (57.1), institutional (54.0), commercial / industrial (50.4)
• Project inquiries index: 62.6
• Design contracts index: 56.9
The regional and sector categories are calculated as a 3-month moving average, whereas the national index, design contracts and inquiries are monthly numbers.
About the AIA Architecture Billings Index
The Architecture Billings Index (ABI), produced by the AIA Economics & Market Research Group, is a leading economic indicator that provides an approximately nine to twelve month glimpse into the future of nonresidential construction spending activity. The diffusion indexes contained in the full report are derived from a monthly “Work-on-the-Boards” survey that is sent to a panel of AIA member-owned firms. Participants are asked whether their billings increased, decreased, or stayed the same in the month that just ended as compared to the prior month, and the results are then compiled into the ABI.
These monthly results are also seasonally adjusted to allow for comparison to prior months. The monthly ABI index scores are centered around 50, with scores above 50 indicating an aggregate increase in billings, and scores below 50 indicating a decline. The regional and sector data are formulated using a three-month moving average. More information on the ABI and the analysis of its relationship to construction activity can be found in the recently released White Paper, Designing the Construction Future: Reviewing the Performance and Extending the Applications of the AIA’s Architecture Billings Index on the AIA website.
Related Stories
Design Innovation Report | Jun 25, 2019
2019 Design Innovation Report: Super labs, dream cabins, office boardwalks, façades as art
9 projects that push the limits of architectural design, space planning, and material innovation.
Airports | May 20, 2019
How the Internet of Things will transform airport environments
Connected devices and their wealth of data have led to significant improvements in operational efficiency and passenger experience in airports.
Hotel Facilities | May 16, 2019
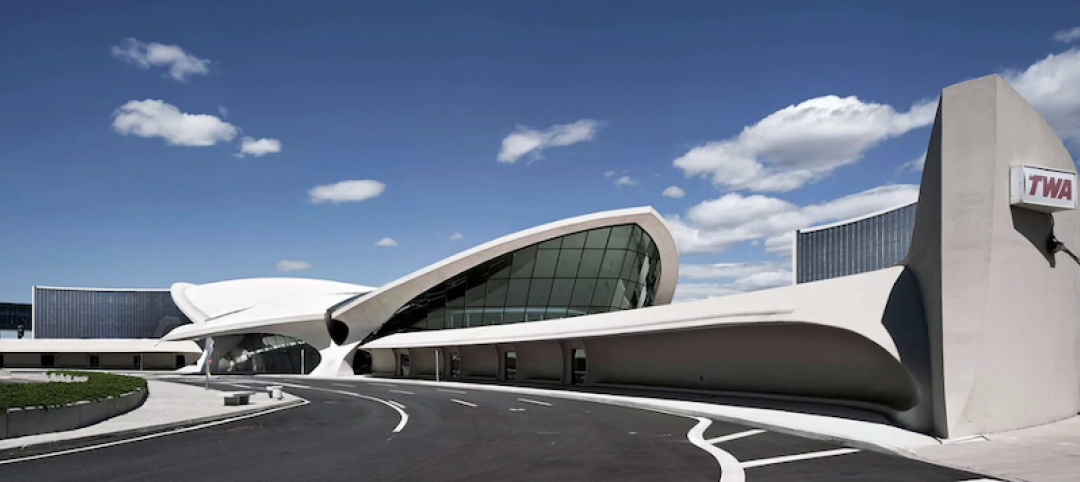
JFK’s TWA Flight Center has been reimagined as a hotel
MCR and Morse Development spearheaded the project.
Airports | May 9, 2019
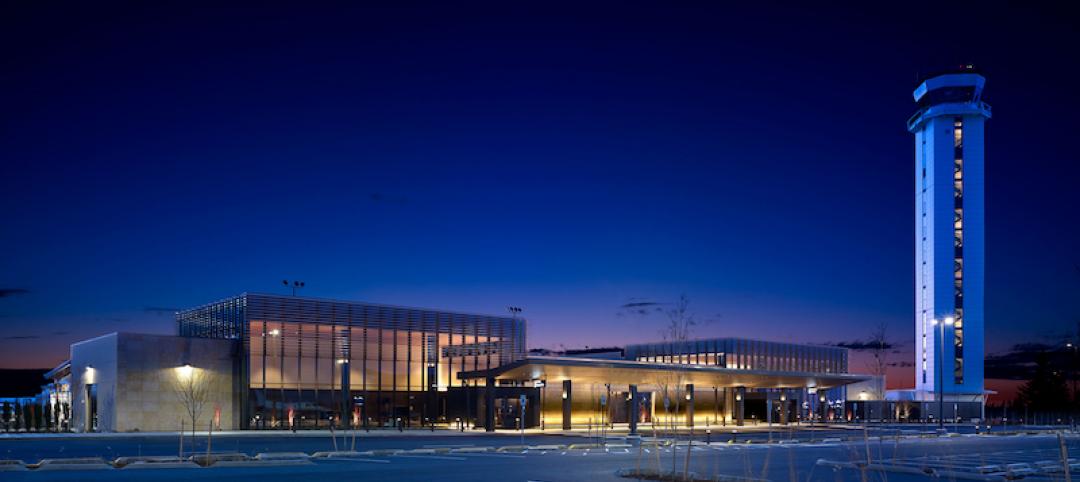
Paine Field-Snohomish County Airport’s new terminal culminates early plan
$40 million redevelopment brands hub as true boutique airport.
Airports | May 1, 2019
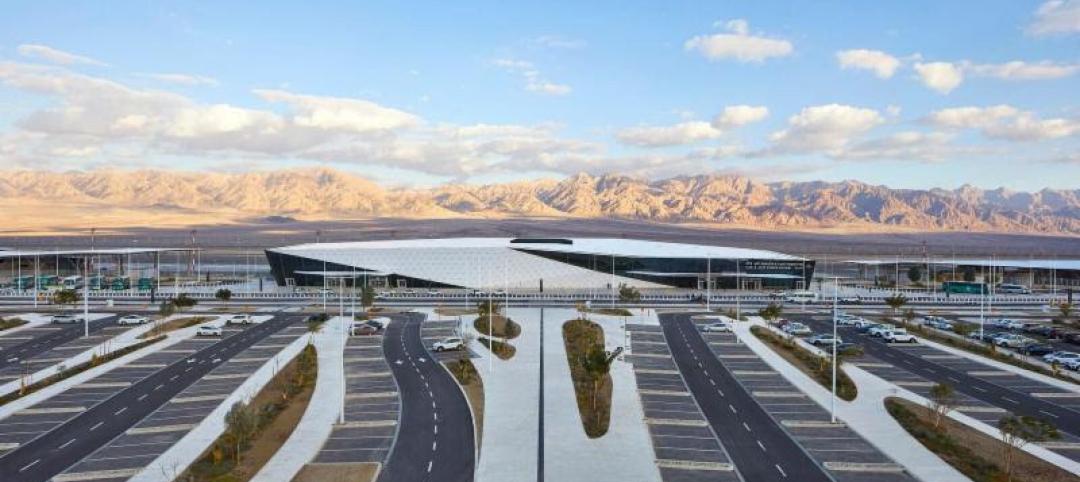
The Ilan and Asaf Ramon International Airport opens in Israel’s Negev Desert
Amir Mann-Ami Shinar Architects and Planners designed the facility in partnership with Moshe Zur Architects.
Airports | Apr 1, 2019
Home team wins O’Hare terminal design competition
Studio ORD, which includes Chicago-based Studio Gang, is chosen from five finalists.
Airports | Mar 21, 2019
First photos inside the nearly completed Jewel Changi Airport addition
The addition is set to open this spring.
Airports | Feb 28, 2019
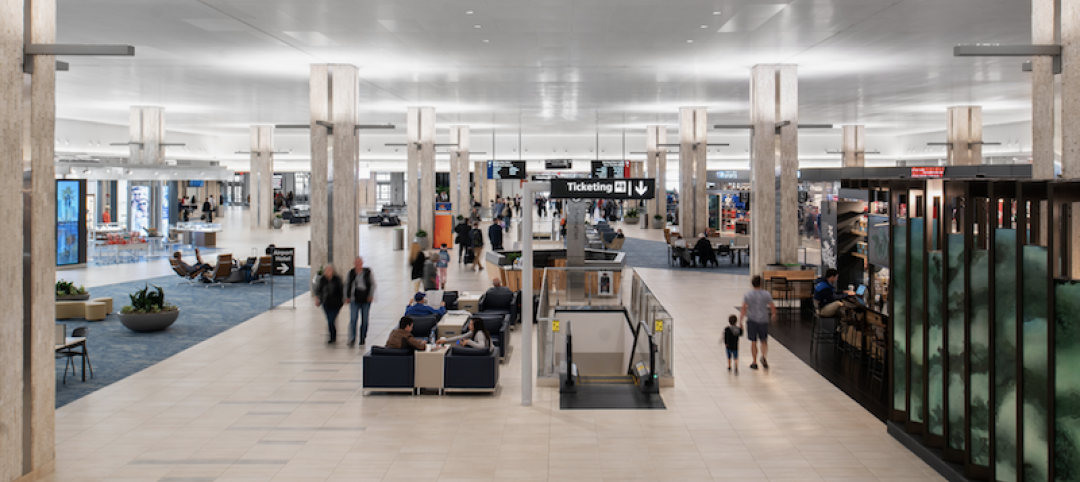
Renovation of Tampa International Airport’s Main Terminal completes
Skanska and HOK led the design-build team.
Airports | Feb 26, 2019
Design team unveils Terminal Modernization Program at Pittsburgh International Airport
The terminal’s design philosophy combines nature, technology, and community.
Airports | Feb 21, 2019
Self-service bag drops and the challenges of speeding up airport baggage check-in
More airports are asking passengers to check their own baggage. What’s the ripple effect?


