The role of campus master planning graphics used to be painting a beautiful picture of the institution’s future. However, campus planning in the age of Big Data has grown more and more complex. It’s also increasingly likely that people without a physical planning or design background will make long-term planning decisions at their institution. Therefore, it is imperative that decision makers are presented with well-thought-out, concise planning graphics to assist them in a clear evaluation process. Three ways in which graphics can assist with the progress of a campus plan are by visualizing data, simplifying complex decisions, and by synthesizing the recommendations into comprehensible phases for funding and construction.
VISUALIZING DATA
Each semester higher education institutions collect data on the demographic makeup of their students. The amount of information stored is overwhelming and can be difficult to grasp in spreadsheet form. Demographic data are important to inform decisions during the planning process, so it is our job as planners to visualize this data in a manner that is attention grabbing and easy to understand for the client.
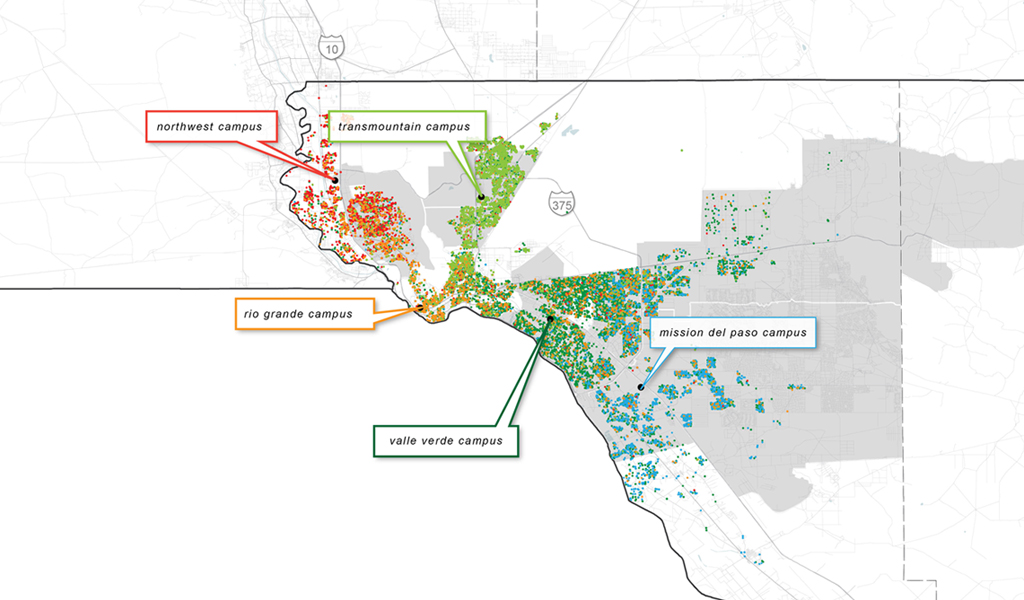
Below is a map of northwest Texas that shows El Paso Community College’s six different campuses. Each dot indicates one student residence location, while the color of the dot represents which campus that student attends.
A student’s address has little value sitting in a spreadsheet, but when geocoded and mapped out along with thousands of their cohort’s locations, a very compelling story can be told. This graphic was created to assist the College in understanding how far students travel to attend particular campuses, as well as to begin a conversation regarding the creation and location of one or more Centers of Excellence.
SIMPLIFYING COMPLEX DECISIONS
Effective design communication can help simplify the process of complex decision making. Decisions made in a campus master planning process often look out fifteen to twenty years in the future, accounting for numerous economic and societal circumstances. The ramifications of multiple projected factors have the potential to hinder decisions and paralyze the planning process.
The animated diagrams below illustrate existing housing units at a college, as well as several different options for the college to expand this housing stock. Visual diagrams were used to clearly communicate potential scenarios for constructing a new student housing building. Looking at information at this high level allowed the client to clearly understand a number of factors, from land use to potential revenue and beds gained. This allowed for an informed site selection for future on-campus housing. Another added benefit is when a client or stakeholder group has the opportunity to fully understand the information contributing to a planning decision, there is a high level of consensus behind that decision.
A GLIMPSE INTO THE FUTURE
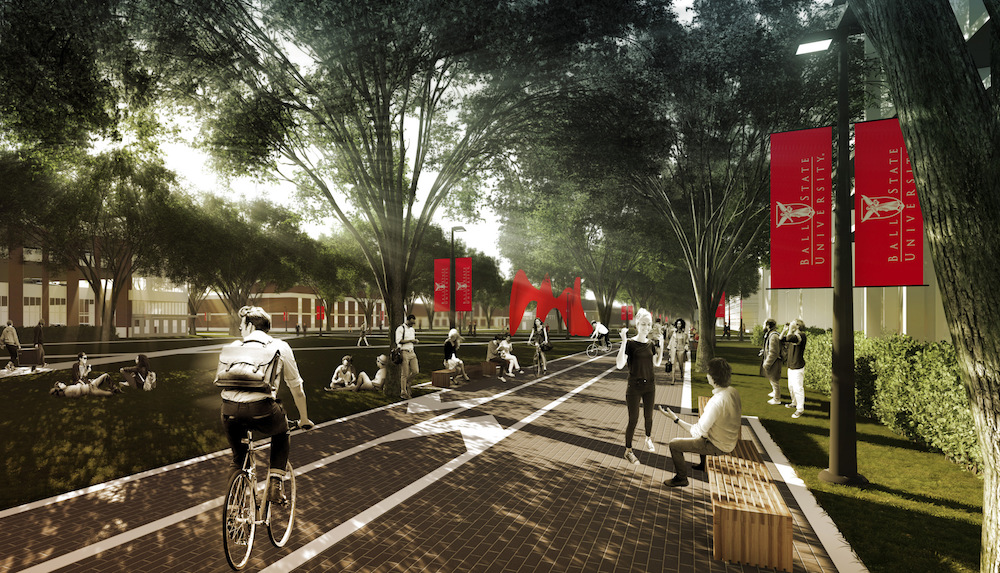
Once the master plan is complete, it is important to make the essence of the plan understandable through a series of future condition renderings. Graphics should vary in scale from the district-wide scope to the perspective of a student on campus. Imagery can help garner support for the plan as a whole and create excitement for specific projects within the plan. Ultimately, the plan is successful if its concepts are implemented, and intriguing graphics are an effective way for an institution to obtain project approvals and funding. Below are a series of renderings that were created for the Ball State University Master Plan. The renderings helped initiate the first phase development of the College of Health Building, which has received funding and is currently in design.
In addition, the East Campus aerial rendering (rendering A above) paired with a fly-through animation (shown below) helped prioritize the renovation of this underutilized part of campus.
The East Campus Mall was such a significant, transformative design recommendation that the campus planning team decided that a single rendering would not be enough on its own. The before-and-after video was created to better illustrate the concept’s value and its potential for implementation to university representatives.
Beautiful graphics have always been a part of campus master planning. Today, it is becoming increasingly important that we harness the data available to us and distill the information into comprehensible and informative graphics that contribute to analysis and decision making, as well as visualize what implementation will mean for institutional success.
About the Author: Michael Bostic is a landscape designer in SmithGroupJJr's Detroit office.
More from Author
SmithGroup | Oct 28, 2024
A case for mid-rise: How multifamily housing can reshape our cities
Often referred to as “five-over-ones,” the mid-rise apartment type is typically comprised of five stories of apartments on top of a concrete “podium” of ground-floor retail. The main criticism of the “five-over-one” is that they are often too predictable.
SmithGroup | Mar 28, 2023
Inclusive design requires relearning how we read space
Pulling from his experience during a campus design workshop, David Johnson, AIA, LEED AP, encourages architects to better understand how to design spaces that are inclusive for everyone.
SmithGroup | Feb 27, 2023
Surfing the Metaversity: The future of online learning?
SmithGroup's tour of the Metaversity gives us insight on bringing together physical and virtual campuses to create a cohesive institution.
SmithGroup | Nov 28, 2022
Data centers are a hot market—don't waste the heat!
SmithGroup's Brian Rener shares a few ways to integrate data centers in mixed-use sites, utilizing waste heat to optimize the energy demands of the buildings.
SmithGroup | Aug 3, 2022
Designing learning environments to support the future of equitable health care
While the shortage of rural health care practitioners was a concern before the COVID-19 pandemic, the public health crisis has highlighted the importance of health equity in the United States and the desperate need for practitioners help meet the needs of patients in vulnerable rural communities.
SmithGroup | Aug 10, 2021
Retail reset: The future of shopping malls
Developers and design partners are coming together to reimagine how malls can create a new generation of mixed-use opportunities.
SmithGroup | May 17, 2021
Future pandemic preparedness at the medical district scale
The current COVID-19 pandemic highlights the concern that we will see more emergency events in the coming years.
SmithGroup | Jan 25, 2021
Amid pandemic, college students value on-campus experience
All the students we interviewed were glad that they returned to campus in one form or another.
SmithGroup | Aug 13, 2020
Renewing the healing role of public parks
While we can’t accurately predict all the ways we will respond to the current COVID-19 pandemic, it should provide a moment of reflection as we see all too clearly the consequences of our exploitation and destruction of nature.
SmithGroup | Jul 21, 2020
How design of senior living communities must change after COVID-19
The cost of maintaining high quality of care and high quality of life for senior living communities has increased up to 73% for senior living communities that remain free of COVID-19 and up to 103% for COVID-19 positive senior living communities.

