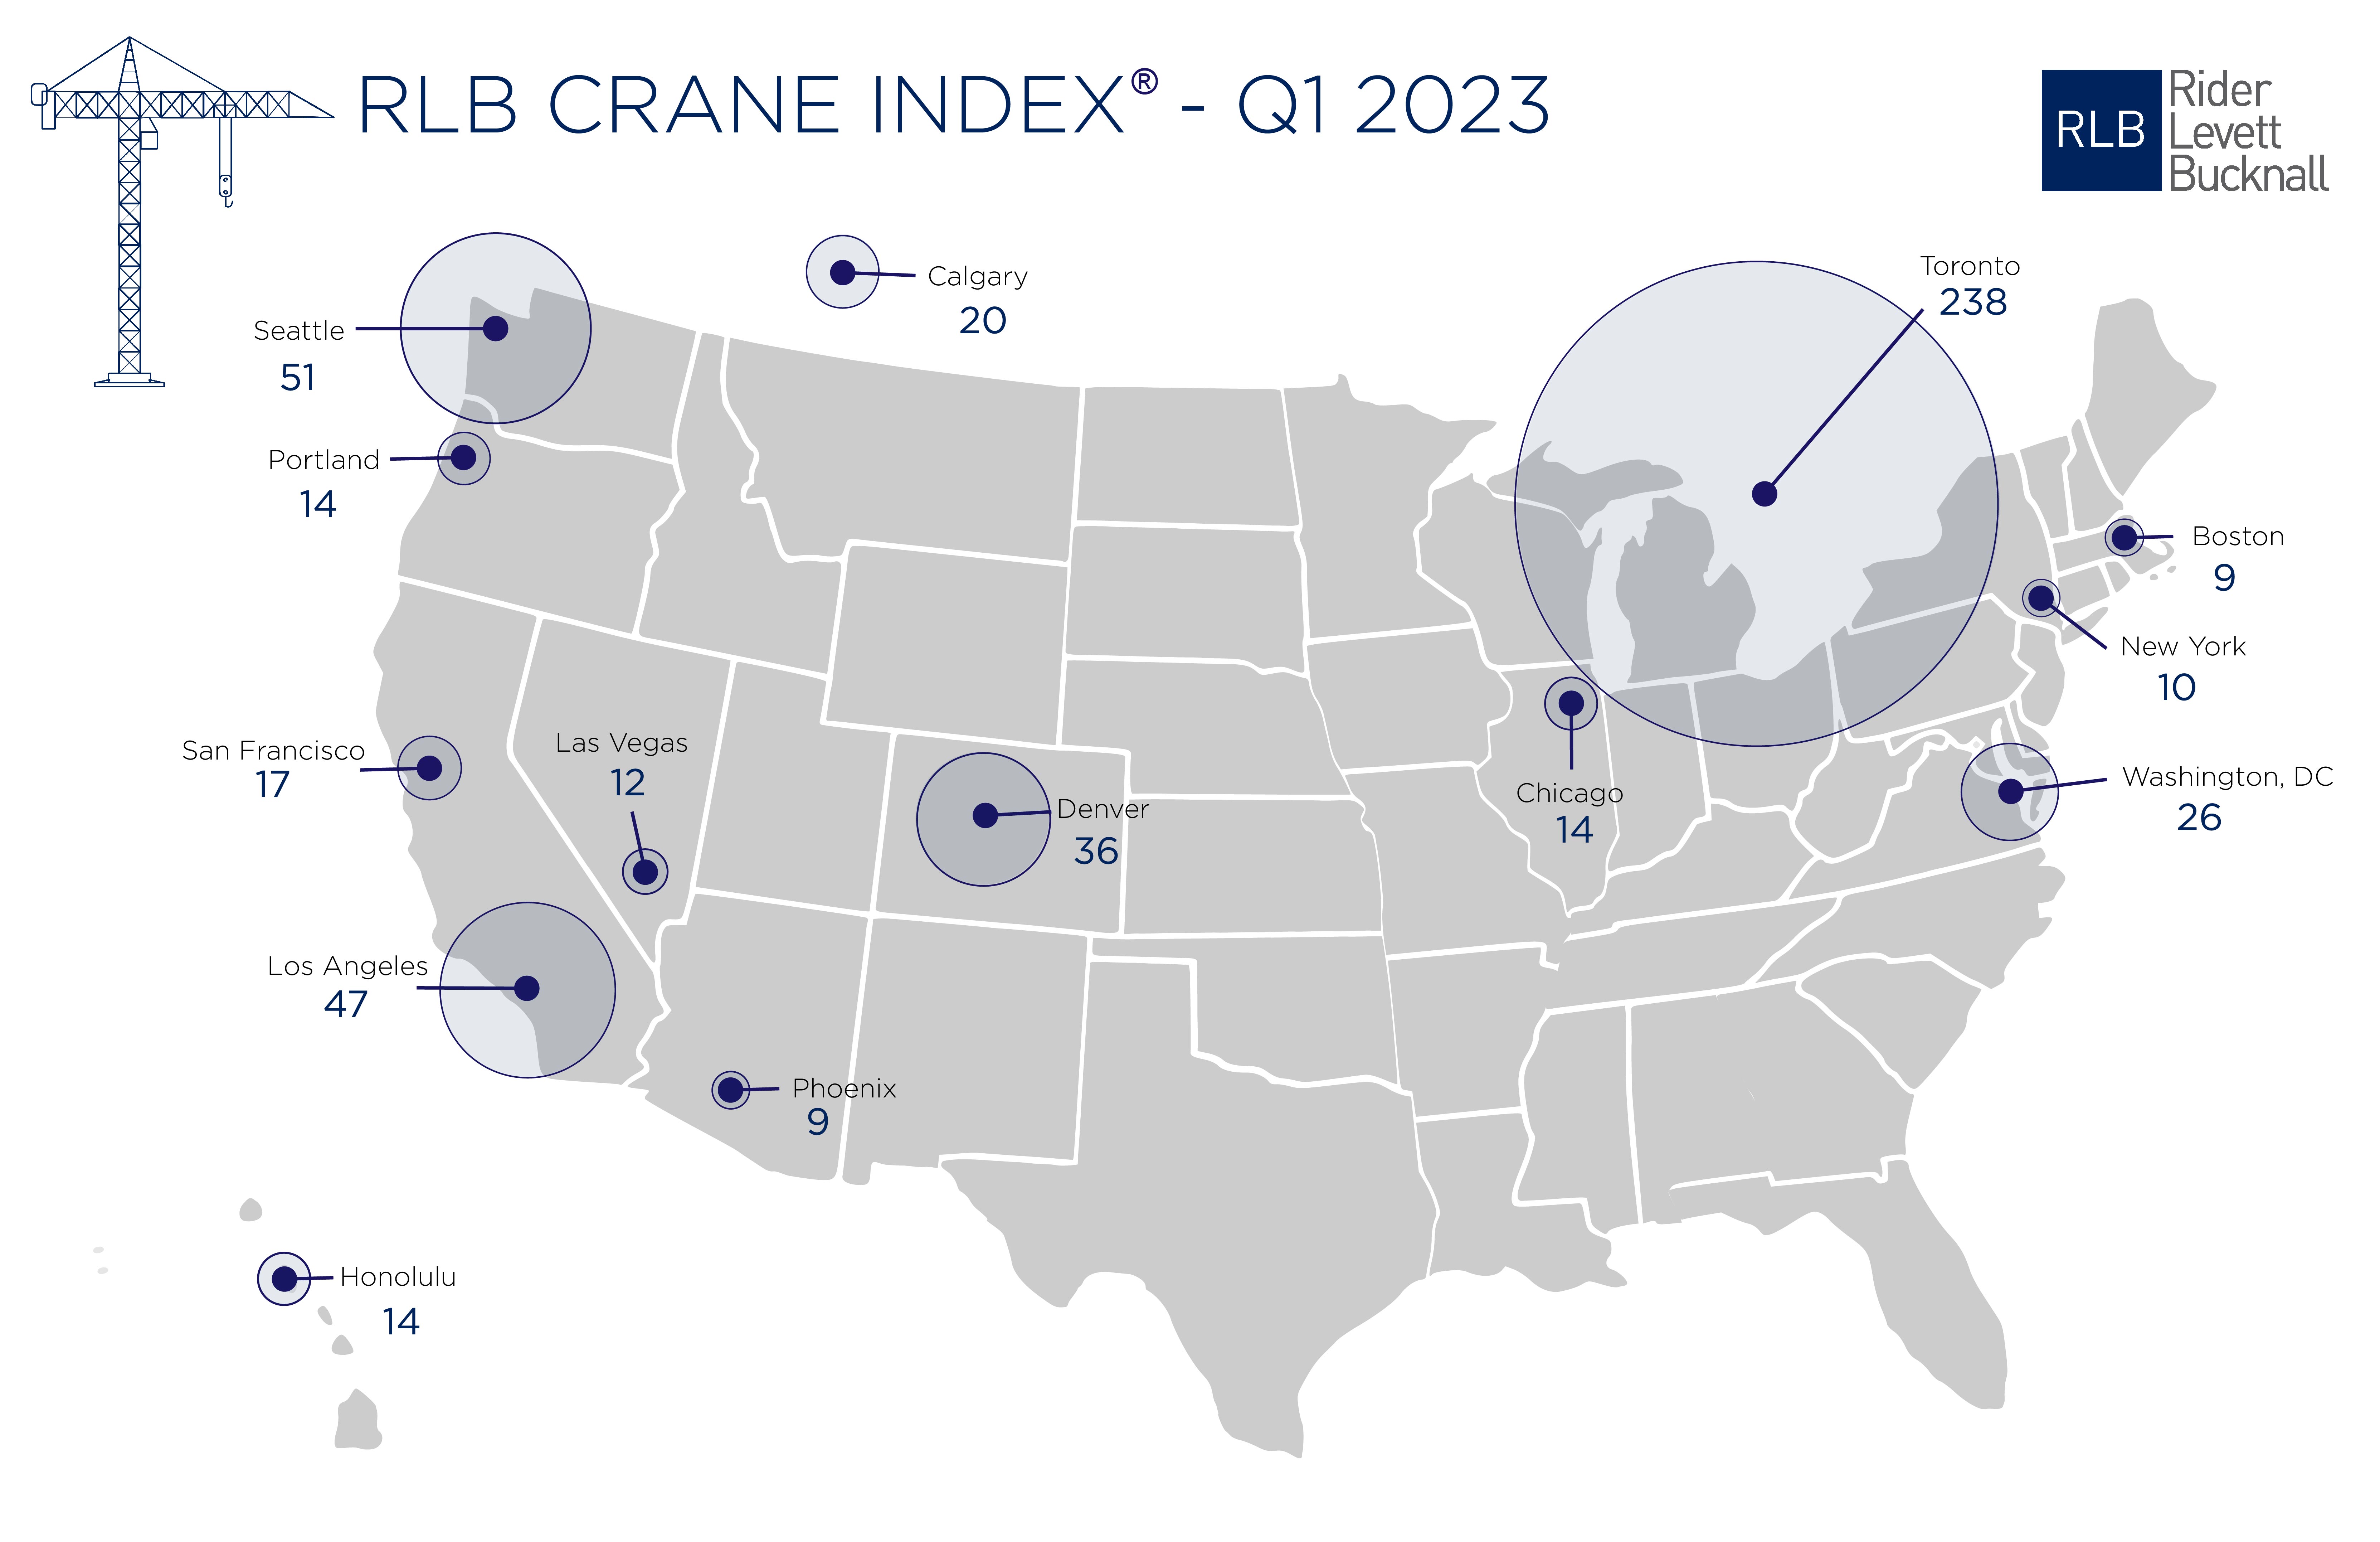
Toronto, Seattle, Los Angeles, and Denver top the list of U.S/Canadian cities with the greatest number of fixed construction cranes on construction sites, according to Rider Levett Bucknall's RLB Crane Index for North America for Q1 2023.
Toronto had a whopping 238 cranes in place in the first quarter. Seattle had 51 cranes to lead all U.S. cities, followed by Los Angeles (47), Denver (36), and Washington, D.C. (26).
The RLB survey reports a nominal increase of 7.04% (34 cranes) from the Q3 2022 edition of the RLB Crane Index. Of the 14 cities surveyed, eight experienced
an increase in cranes, two decreased, and four held steady.
The three top sectors across all cities are residential (51%), mixed use (22%), and commercial (12%).
"Despite continued workforce challenges and economic uncertainties are still concerns for the coming year, we are continuing to see new projects break ground within our 14-key markets. This indicates that investments are continuing to be made into our cities," said the report's authors.
"Notwithstanding concerns for the housing market, residential and mixed-use projects make up 73% of the overall count. We anticipate the number of cranes to remain high into 2023. Despite uncertain market conditions, construction projects will continue to break ground, albeit at a cost," the added.
About the RLB Crane Index
Rider Levett Bucknall’s Crane Index for North America is published biannually. It tracks the number of operating tower cranes in 14 major cities across the U.S. and Canada. The index was the first of its kind, and unlike other industry barometers that track cost and other financial data, the Crane Index tracks the number of fixed cranes on construction sites and gives a simplified measure of the current state of the construction industry’s workload in each location.
Related Stories
Market Data | Nov 10, 2021
Construction input prices see largest monthly increase since June
Construction input prices are 21.1% higher than in October 2020.
Market Data | Nov 9, 2021
Continued increases in construction materials prices starting to drive up price of construction projects
Supply chain and labor woes continue.
Market Data | Nov 5, 2021
Construction firms add 44,000 jobs in October
Gain occurs even as firms struggle with supply chain challenges.
Market Data | Nov 3, 2021
One-fifth of metro areas lost construction jobs between September 2020 and 2021
Beaumont-Port Arthur, Texas and Sacramento--Roseville--Arden-Arcade Calif. top lists of gainers.
Market Data | Nov 2, 2021
Construction spending slumps in September
A drop in residential work projects adds to ongoing downturn in private and public nonresidential.
Hotel Facilities | Oct 28, 2021
Marriott leads with the largest U.S. hotel construction pipeline at Q3 2021 close
In the third quarter alone, Marriott opened 60 new hotels/7,882 rooms accounting for 30% of all new hotel rooms that opened in the U.S.
Hotel Facilities | Oct 28, 2021
At the end of Q3 2021, Dallas tops the U.S. hotel construction pipeline
The top 25 U.S. markets account for 33% of all pipeline projects and 37% of all rooms in the U.S. hotel construction pipeline.
Market Data | Oct 27, 2021
Only 14 states and D.C. added construction jobs since the pandemic began
Supply problems, lack of infrastructure bill undermine recovery.
Market Data | Oct 26, 2021
U.S. construction pipeline experiences highs and lows in the third quarter
Renovation and conversion pipeline activity remains steady at the end of Q3 ‘21, with conversion projects hitting a cyclical peak, and ending the quarter at 752 projects/79,024 rooms.
Market Data | Oct 19, 2021
Demand for design services continues to increase
The Architecture Billings Index (ABI) score for September was 56.6.


