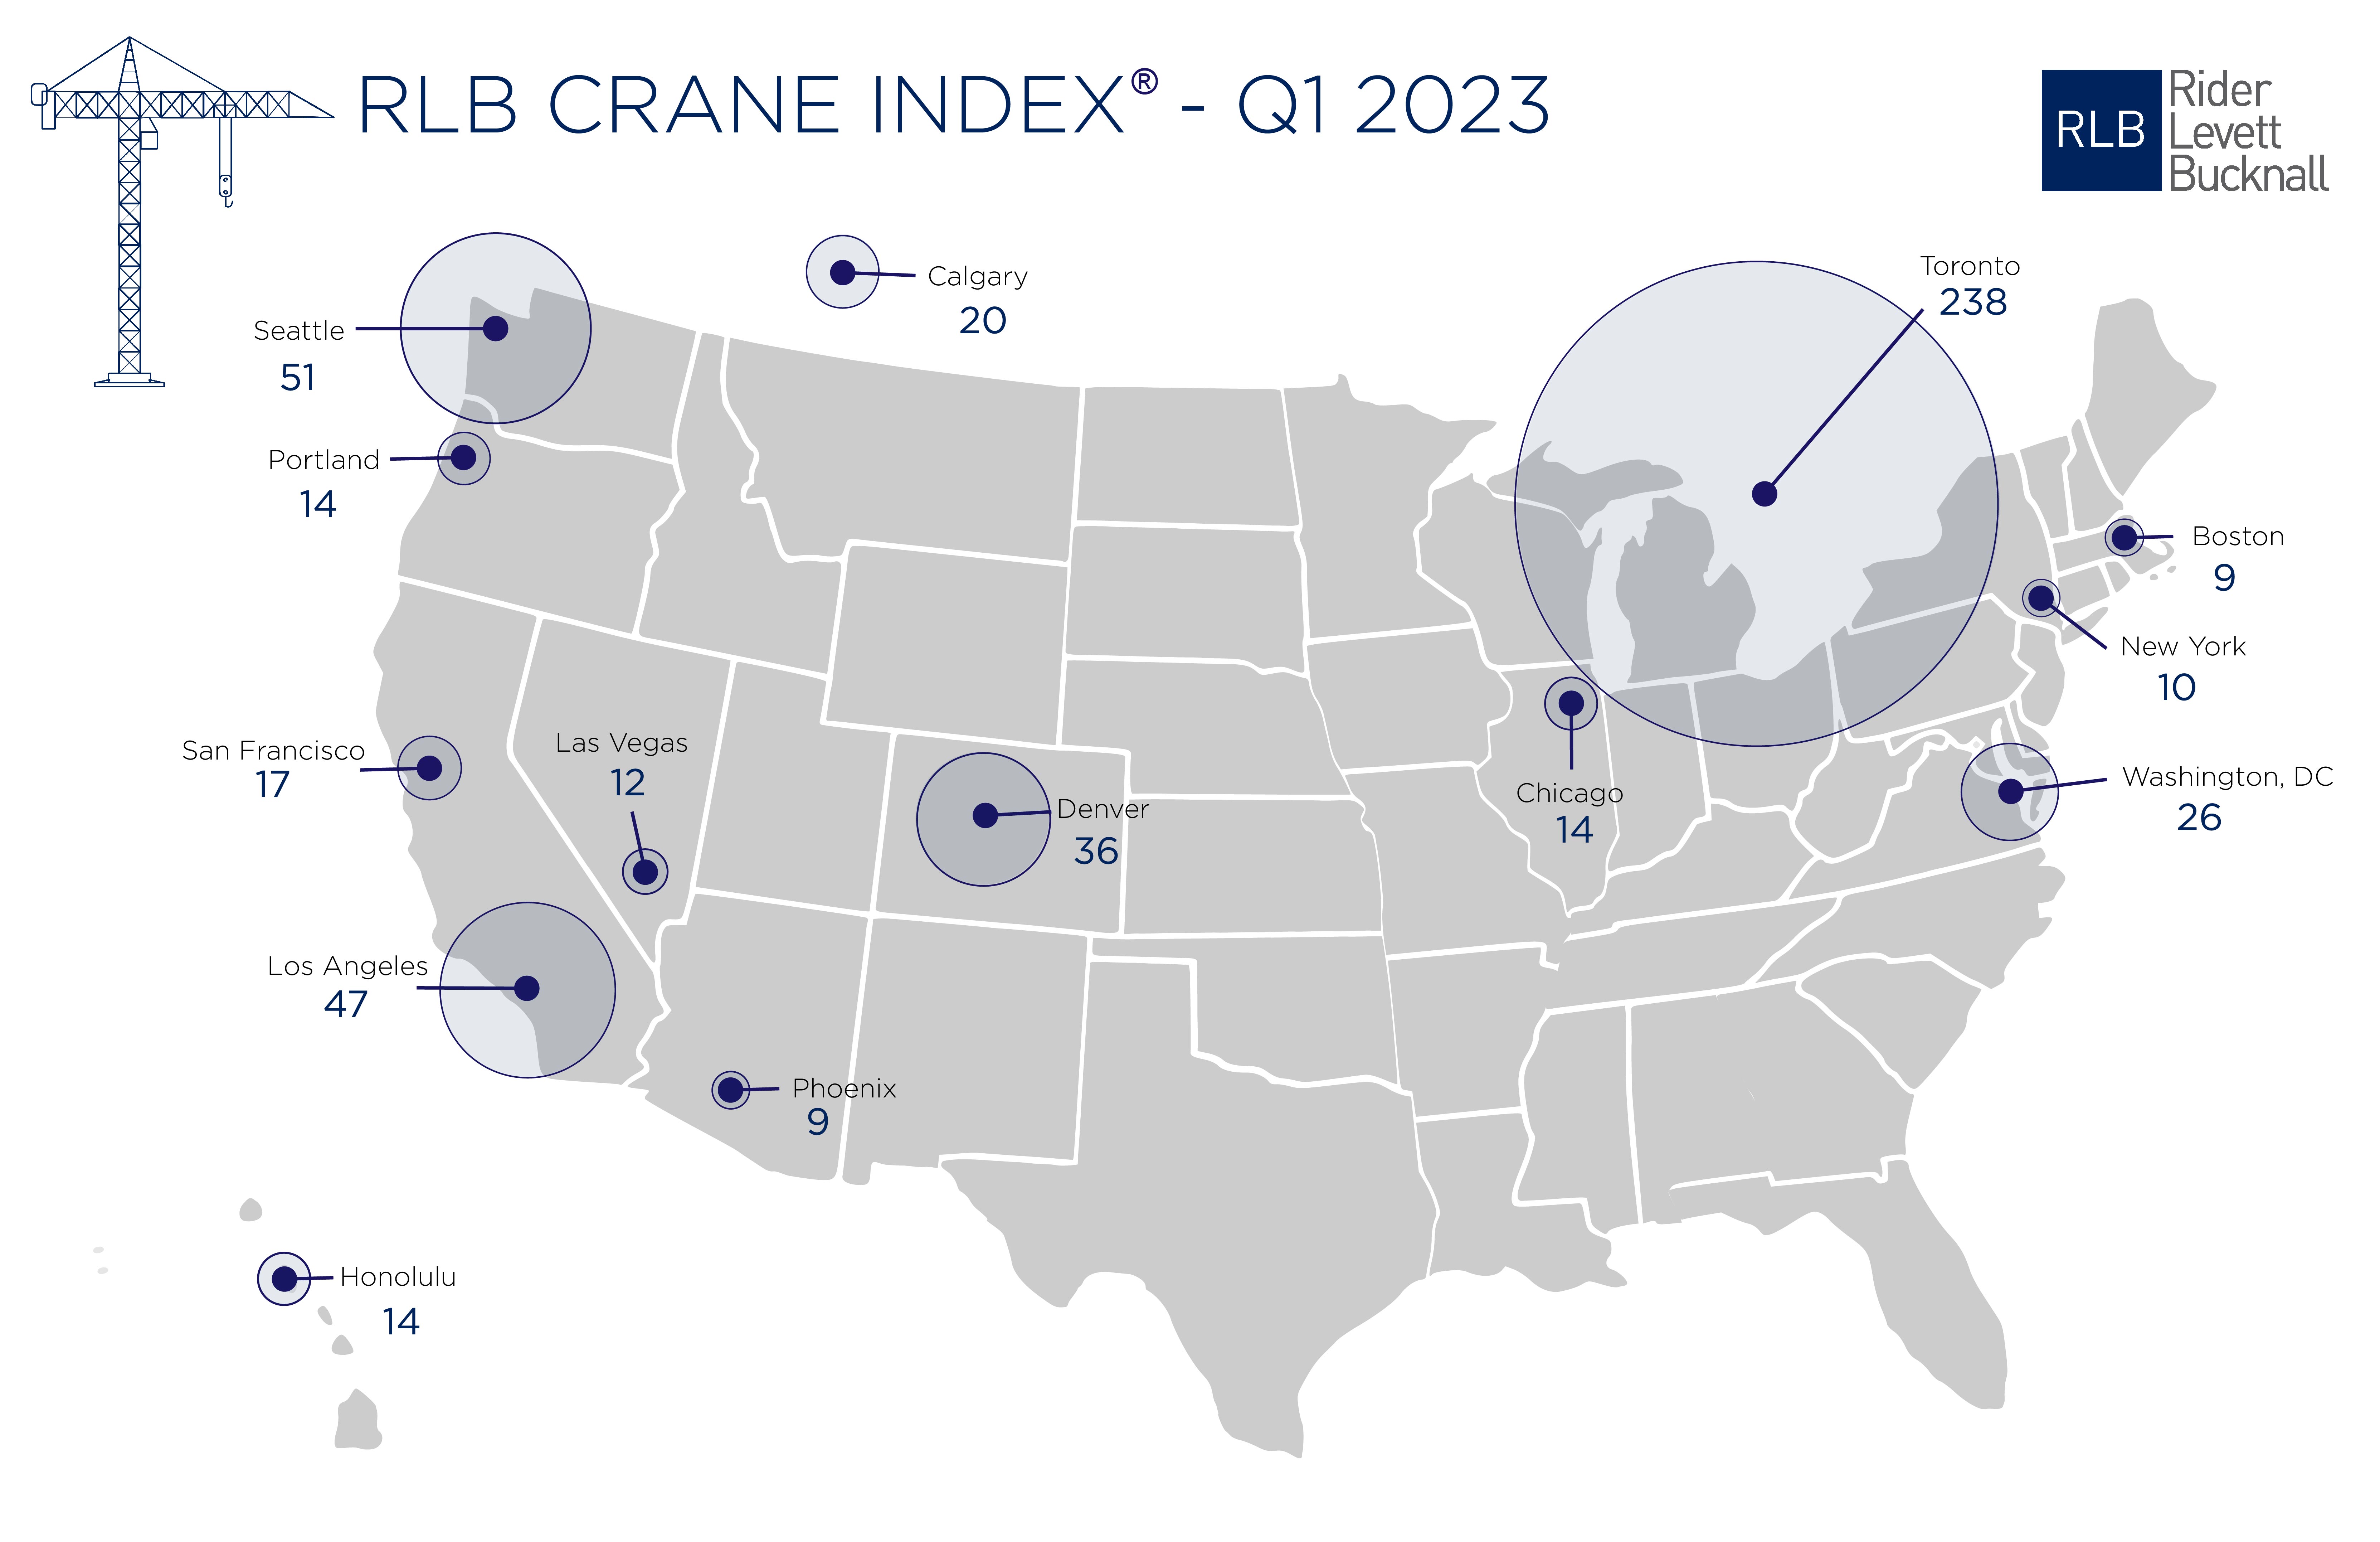
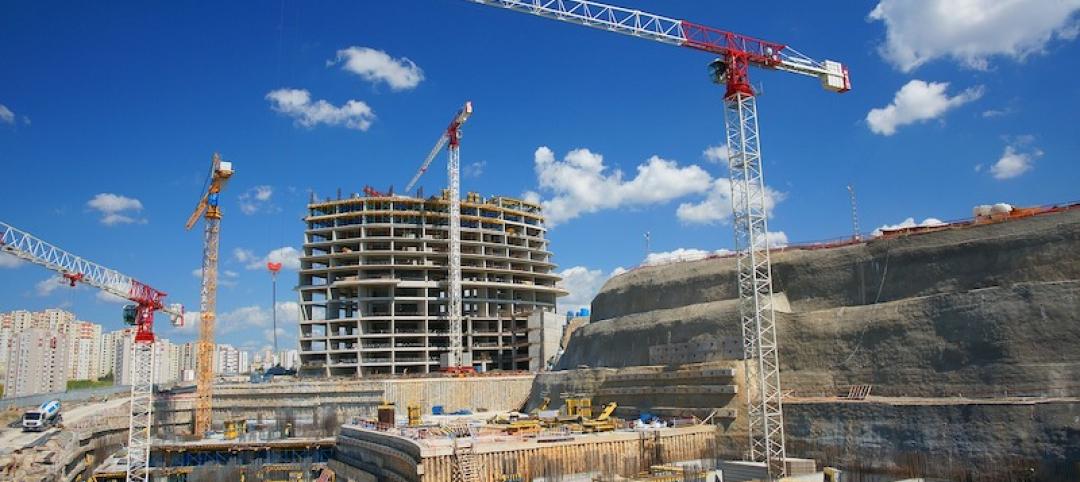
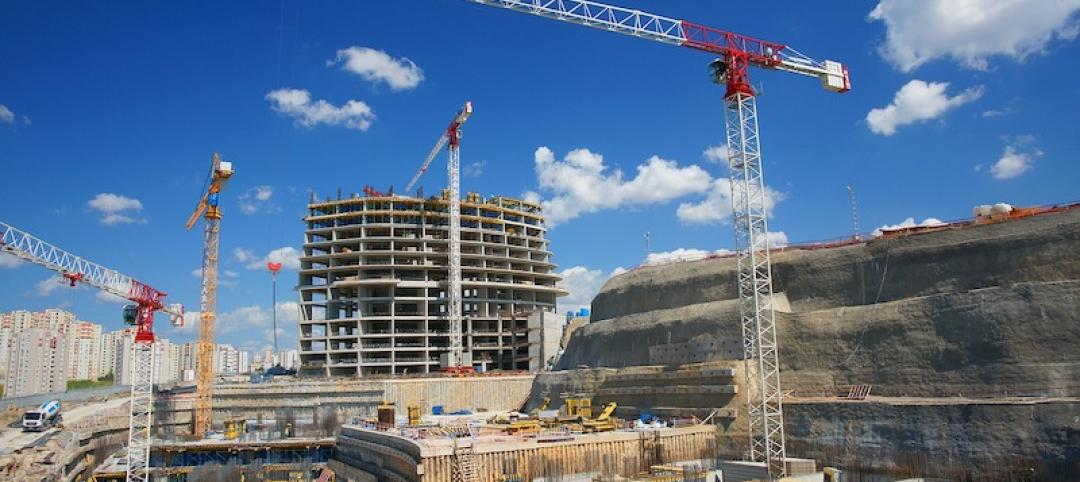
Toronto, Seattle, Los Angeles, and Denver top the list of U.S/Canadian cities with the greatest number of fixed construction cranes on construction sites, according to Rider Levett Bucknall's RLB Crane Index for North America for Q1 2023.
Toronto had a whopping 238 cranes in place in the first quarter. Seattle had 51 cranes to lead all U.S. cities, followed by Los Angeles (47), Denver (36), and Washington, D.C. (26).
The RLB survey reports a nominal increase of 7.04% (34 cranes) from the Q3 2022 edition of the RLB Crane Index. Of the 14 cities surveyed, eight experienced
an increase in cranes, two decreased, and four held steady.
The three top sectors across all cities are residential (51%), mixed use (22%), and commercial (12%).
"Despite continued workforce challenges and economic uncertainties are still concerns for the coming year, we are continuing to see new projects break ground within our 14-key markets. This indicates that investments are continuing to be made into our cities," said the report's authors.
"Notwithstanding concerns for the housing market, residential and mixed-use projects make up 73% of the overall count. We anticipate the number of cranes to remain high into 2023. Despite uncertain market conditions, construction projects will continue to break ground, albeit at a cost," the added.
About the RLB Crane Index
Rider Levett Bucknall’s Crane Index for North America is published biannually. It tracks the number of operating tower cranes in 14 major cities across the U.S. and Canada. The index was the first of its kind, and unlike other industry barometers that track cost and other financial data, the Crane Index tracks the number of fixed cranes on construction sites and gives a simplified measure of the current state of the construction industry’s workload in each location.
Related Stories
Market Data | Jul 15, 2021
Producer prices for construction materials and services soar 26% over 12 months
Contractors cope with supply hitches, weak demand.
Market Data | Jul 13, 2021
ABC’s Construction Backlog Indicator and Contractor Confidence Index rise in June
ABC’s Construction Confidence Index readings for sales, profit margins and staffing levels increased modestly in June.
Market Data | Jul 8, 2021
Encouraging construction cost trends are emerging
In its latest quarterly report, Rider Levett Bucknall states that contractors’ most critical choice will be selecting which building sectors to target.
Multifamily Housing | Jul 7, 2021
Make sure to get your multifamily amenities mix right
One of the hardest decisions multifamily developers and their design teams have to make is what mix of amenities they’re going to put into each project. A lot of squiggly factors go into that decision: the type of community, the geographic market, local recreation preferences, climate/weather conditions, physical parameters, and of course the budget. The permutations are mind-boggling.
Market Data | Jul 7, 2021
Construction employment declines by 7,000 in June
Nonresidential firms struggle to find workers and materials to complete projects.
Market Data | Jun 30, 2021
Construction employment in May trails pre-covid levels in 91 metro areas
Firms struggle to cope with materials, labor challenges.
Market Data | Jun 23, 2021
Construction employment declines in 40 states between April and May
Soaring material costs, supply-chain disruptions impede recovery.
Market Data | Jun 22, 2021
Architecture billings continue historic rebound
AIA’s Architecture Billings Index (ABI) score for May rose to 58.5 compared to 57.9 in April.
Market Data | Jun 17, 2021
Commercial construction contractors upbeat on outlook despite worsening material shortages, worker shortages
88% indicate difficulty in finding skilled workers; of those, 35% have turned down work because of it.
Market Data | Jun 16, 2021
Construction input prices rise 4.6% in May; softwood lumber prices up 154% from a year ago
Construction input prices are 24.3% higher than a year ago, while nonresidential construction input prices increased 23.9% over that span.


