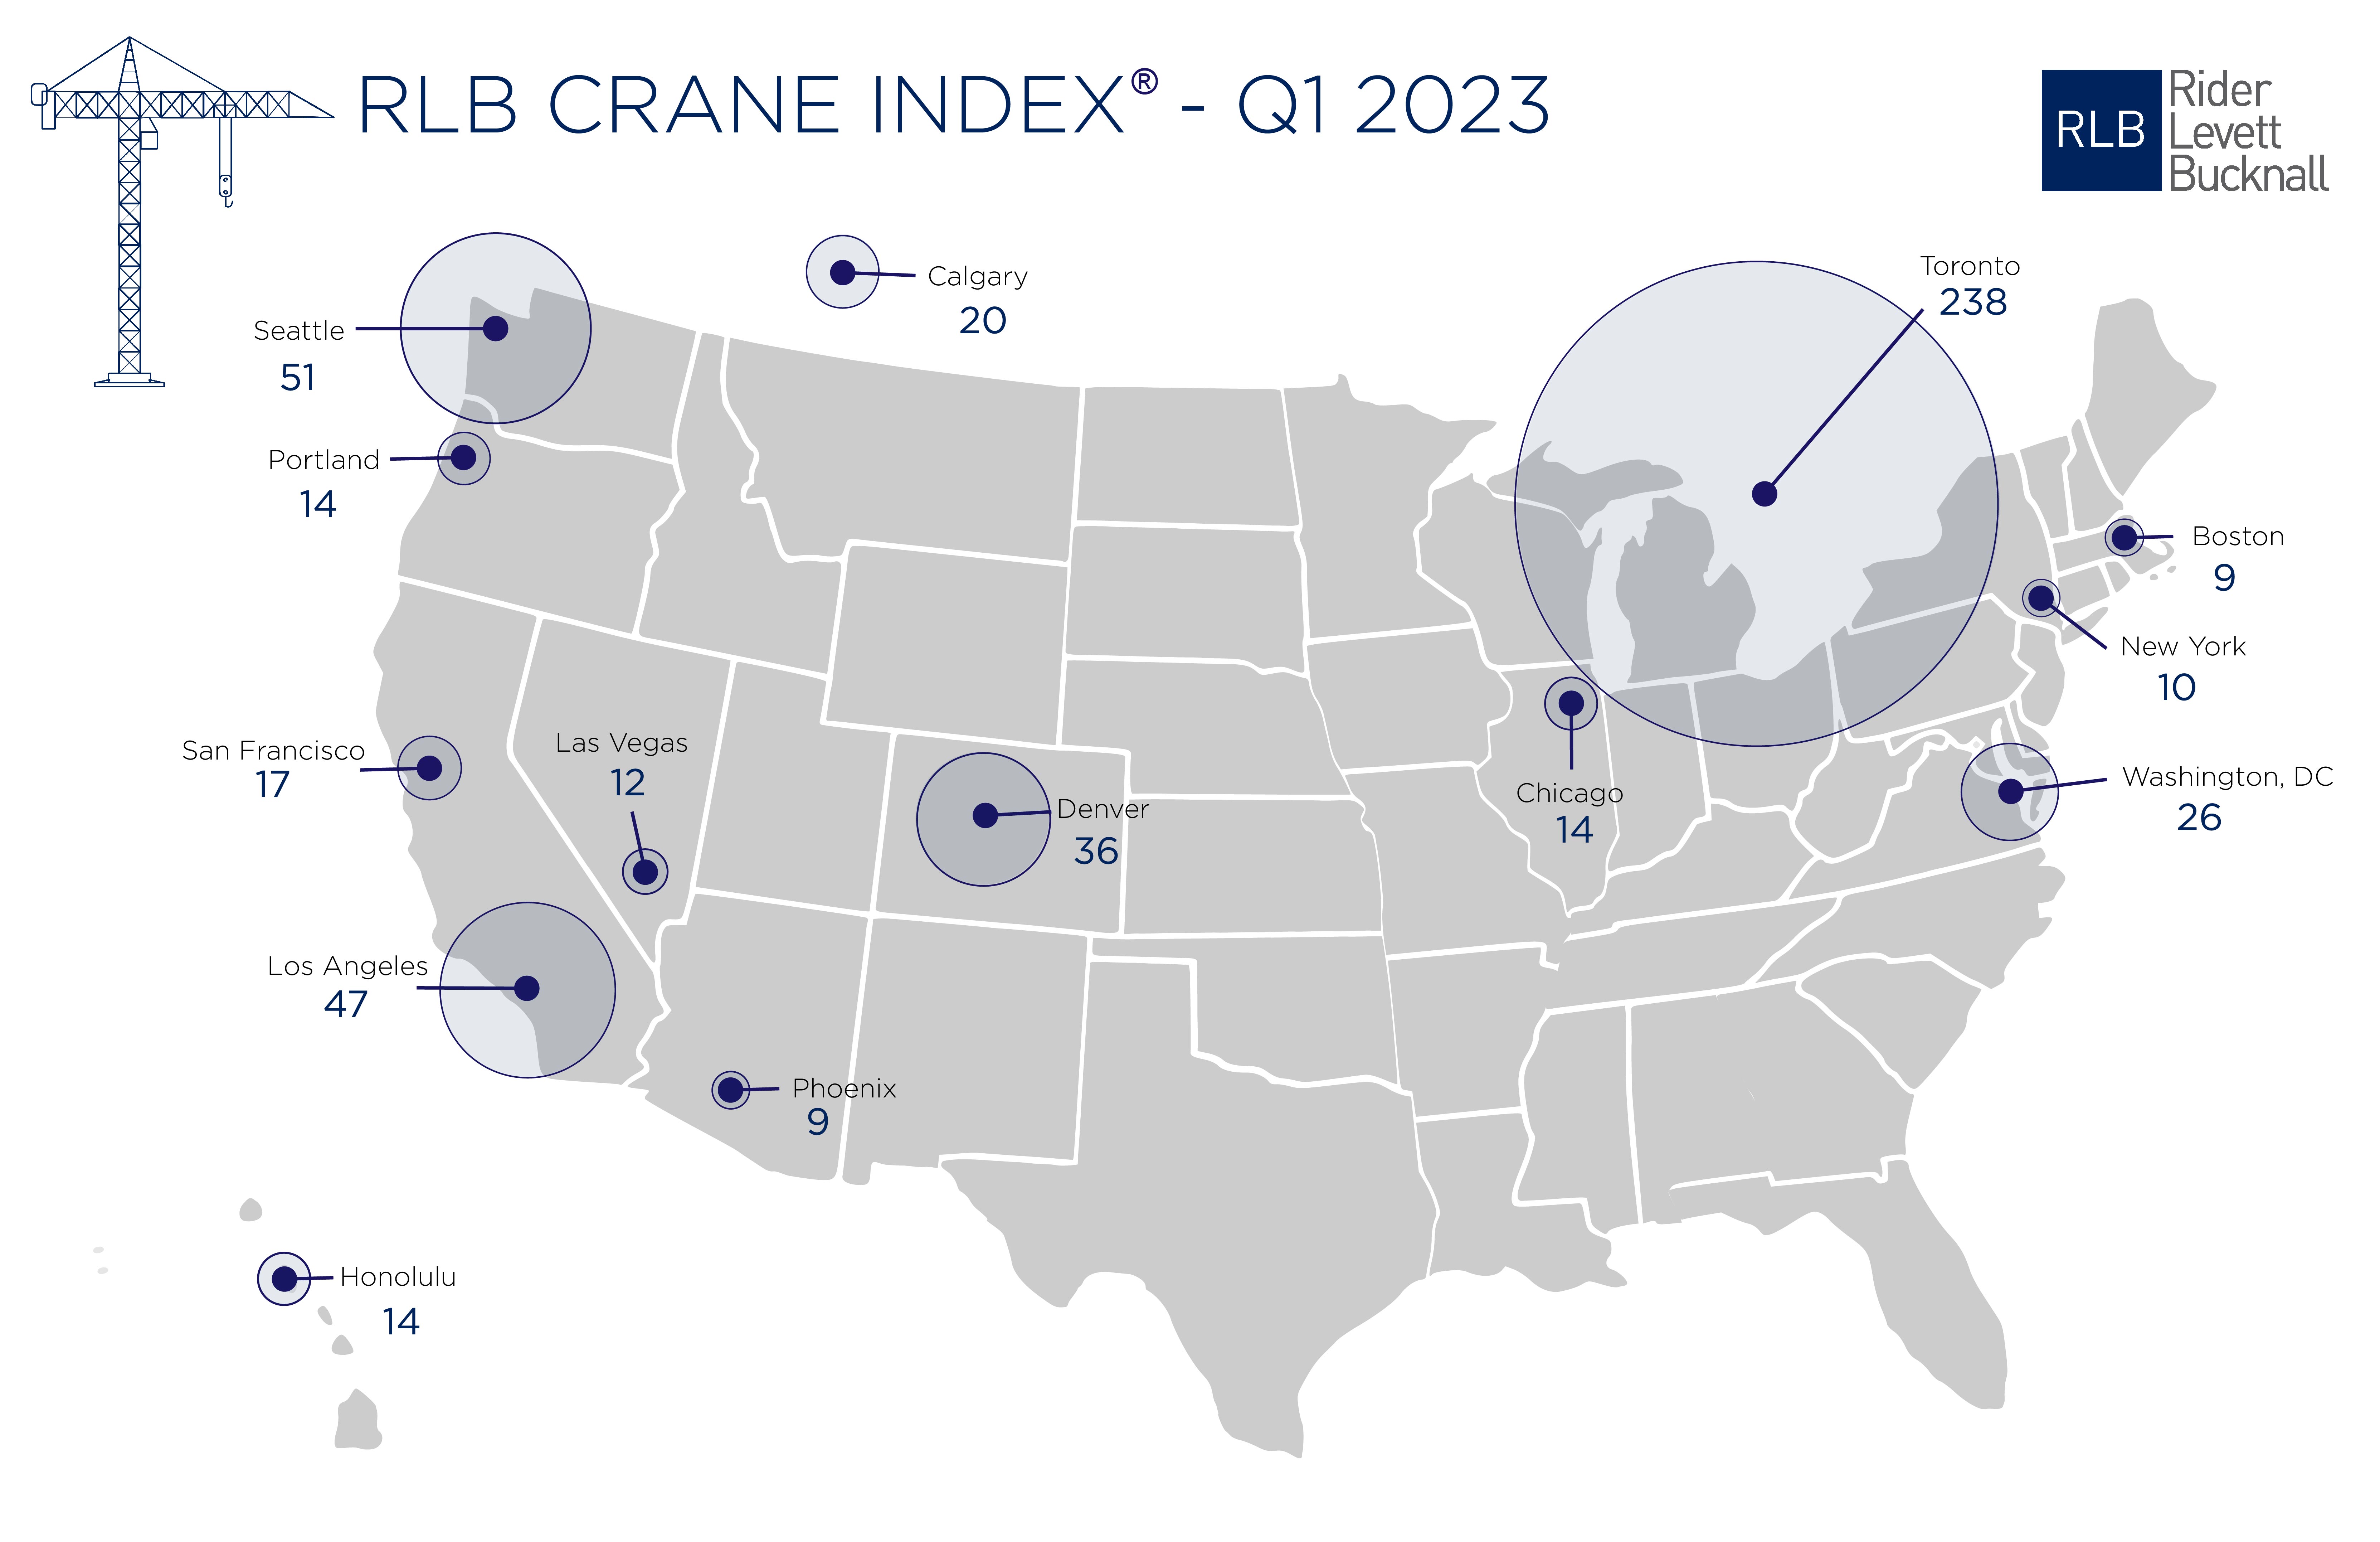
Toronto, Seattle, Los Angeles, and Denver top the list of U.S/Canadian cities with the greatest number of fixed construction cranes on construction sites, according to Rider Levett Bucknall's RLB Crane Index for North America for Q1 2023.
Toronto had a whopping 238 cranes in place in the first quarter. Seattle had 51 cranes to lead all U.S. cities, followed by Los Angeles (47), Denver (36), and Washington, D.C. (26).
The RLB survey reports a nominal increase of 7.04% (34 cranes) from the Q3 2022 edition of the RLB Crane Index. Of the 14 cities surveyed, eight experienced
an increase in cranes, two decreased, and four held steady.
The three top sectors across all cities are residential (51%), mixed use (22%), and commercial (12%).
"Despite continued workforce challenges and economic uncertainties are still concerns for the coming year, we are continuing to see new projects break ground within our 14-key markets. This indicates that investments are continuing to be made into our cities," said the report's authors.
"Notwithstanding concerns for the housing market, residential and mixed-use projects make up 73% of the overall count. We anticipate the number of cranes to remain high into 2023. Despite uncertain market conditions, construction projects will continue to break ground, albeit at a cost," the added.
About the RLB Crane Index
Rider Levett Bucknall’s Crane Index for North America is published biannually. It tracks the number of operating tower cranes in 14 major cities across the U.S. and Canada. The index was the first of its kind, and unlike other industry barometers that track cost and other financial data, the Crane Index tracks the number of fixed cranes on construction sites and gives a simplified measure of the current state of the construction industry’s workload in each location.
Related Stories
Coronavirus | Mar 20, 2020
Pandemic has halted or delayed projects for 28% of contractors
Coronavirus-caused slowdown contrasts with January figures showing a majority of metro areas added construction jobs; Officials note New infrastructure funding and paid family leave fixes are needed.
Market Data | Mar 17, 2020
Construction spending to grow modestly in 2020, predicts JLL’s annual outlook
But the coronavirus has made economic forecasting perilous.
Market Data | Mar 16, 2020
Grumman/Butkus Associates publishes 2019 edition of Hospital Benchmarking Survey
Report examines electricity, fossil fuel, water/sewer, and carbon footprint.
Market Data | Mar 12, 2020
New study from FMI and Autodesk finds construction organizations with the highest levels of trust perform twice as well on crucial business metrics
Higher levels of trust within organizations and across project teams correlate with increased profit margins, employee retention and repeat business that can all add up to millions of dollars of profitability annually.
Market Data | Mar 11, 2020
The global hotel construction pipeline hits record high at 2019 year-end
Projects currently under construction stand at a record 991 projects with 224,354 rooms.
Market Data | Mar 6, 2020
Construction employment increases by 43,000 in February and 223,000 over 12 months
Average hourly earnings in construction top private sector average by 9.9% as construction firms continue to boost pay and benefits in effort to attract and retain qualified hourly craft workers.
Market Data | Mar 4, 2020
Nonresidential construction spending attains all-time high in January
Private nonresidential spending rose 0.8% on a monthly basis and is up 0.5% compared to the same time last year.
Market Data | Feb 21, 2020
Construction contractor confidence remains steady
70% of contractors expect their sales to increase over the first half of 2020.
Market Data | Feb 20, 2020
U.S. multifamily market gains despite seasonal lull
The economy’s steady growth buoys prospects for continued strong performance.
Market Data | Feb 19, 2020
Architecture billings continue growth into 2020
Demand for design services increases across all building sectors.


