Nonresidential construction spending, which rose by 3.5% in the second half of 2019, is expected to increase in 2020, albeit at a modest 2% clip, with demand projected to weaken as the year goes on.
In its Construction Outlook for the U.S. 2020, JLL attributed last year’s performance mostly to the 10.1% rise in public spending. Construction employment was up 2.1% to 6.44 million, and construction unemployment dipped to 4.5%. Indexed building costs increased 1.5% year-over-year.
In 2020, the dollar value of construction starts (according to Dodge Data & Analytics) is expected to decline by nearly 5%. And JLL expects the disparity between public and private nonres construction spending to continue.
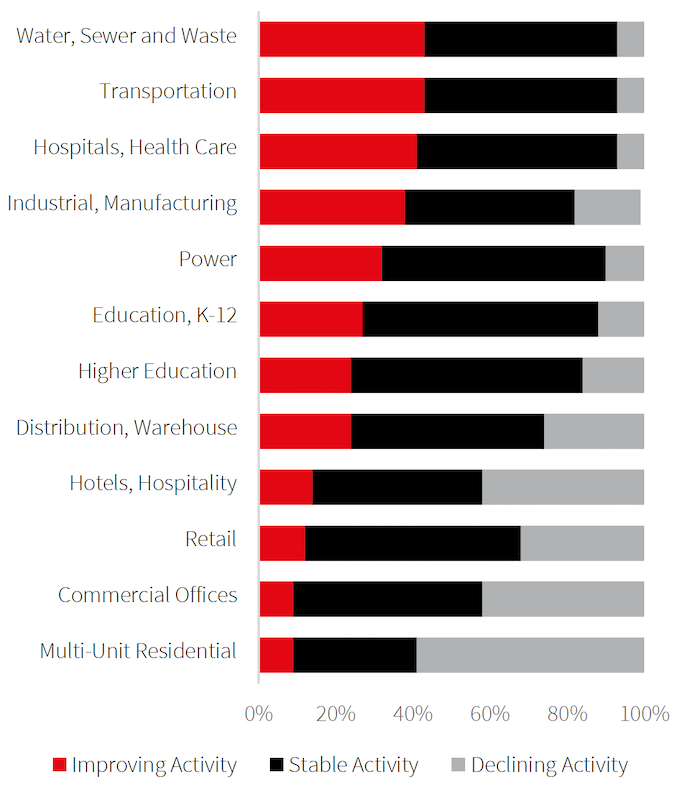
With nearly all growth in construction spending coming from public dollars, the sectors expected to do well this year will be those with the most public investment, such as transportation, education, healthcare and public safety. The reverse will be true about multifamily residential, commercial office, hotels, and retail.
JLL forecasts construction inflation to fall somewhere between 1% and 3%, and by a bit higher percentages on the labor side.
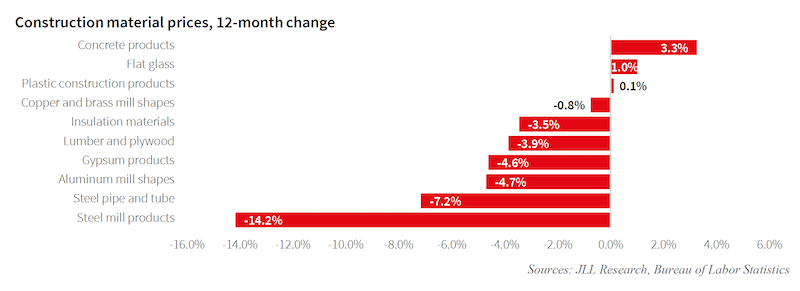
Inflation in the cost of construction materials has been held in check.
JLL was reluctant to speculate on the impact of the coronavirus on construction. But it did note that roughly between one-quarter and one-third of all construction products in the U.S. are sourced from China, so any sustained slowdown in Chinese production due to the spread of COVID 19 may cause material shortages in the U.S.
The Outlook’s projections about the U.S. economy—that it would remain strong enough in 2020 to keep the construction industry on track overall, but would not provide the private investment fuel that would be necessary for robust growth—were made before the economy appeared to be sinking into recession in mid March.
On the plus side, the Outlook points out that the ratified U.S.-Mexico-Canada Agreement is on track to be fully implemented in 2020. “The agreement brings stability to critical material markets for the construction industry, particularly for lumber, steel and aluminum,” JLL posited. Across the Pacific, the U.S. and China signed a Phase One agreement to roll back a very small portion of the tariffs that were imposed between the two countries over the past few years. Phase One represents the first time under the Trump administration that average tariff rates on Chinese imports have declined.
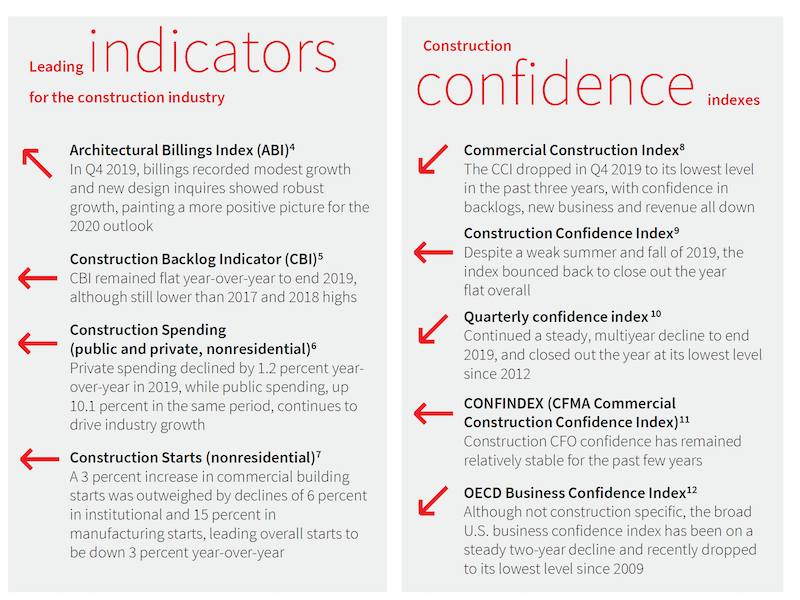
Construction confidence was flat to down in 2019, according to several measurements.
Much of the Outlook was actually devoted to recounting key metrics from last year. It points out, for example, that construction confidence was flat in 2019, while the Commercial Construction Index, as aggregated by the U.S. Chamber of Commerce and USG, dropped in the fourth quarter to its lower level in three years.
Last year, the rate of increase for construction materials eased a bit, to 3%, with most of that increase occurring in the first half of the year. Steel-mill products, in fact, experienced a 14.2% decrease over the 12-month period.
The most expensive cities with more than 150,000 people to build in last year were the usual suspects: New York, San Francisco, Chicago, Honolulu, and Fairbanks, Alaska. The least expensive were Knoxville, Tenn., Austin, Amarillo, Texas, Little Rock, Ark., and El Paso, Texas.
JLL’s Outlook also provides regional comparisons for the years 2008 through 2019. In that context, for example, warehouses were the strongest construction sector in the Midwest and Northeast, Amusement & Recreation in the West, and Auto Service/Parts in the South. The sectors with the greatest decline over that decade were bank and financial offices (Northeast and South), Multiretail (West), and houses of worship (Midwest).
As for overall growth during this 10-year period. the Northeast, West, and Midwest fell short of the national average in terms of construction backlog, while the South outperformed the country as a whole.
Related Stories
Market Data | Aug 12, 2021
Steep rise in producer prices for construction materials and services continues in July.
The producer price index for new nonresidential construction rose 4.4% over the past 12 months.
Market Data | Aug 6, 2021
Construction industry adds 11,000 jobs in July
Nonresidential sector trails overall recovery.
Market Data | Aug 2, 2021
Nonresidential construction spending falls again in June
The fall was driven by a big drop in funding for highway and street construction and other public work.
Market Data | Jul 29, 2021
Outlook for construction spending improves with the upturn in the economy
The strongest design sector performers for the remainder of this year are expected to be health care facilities.
Market Data | Jul 29, 2021
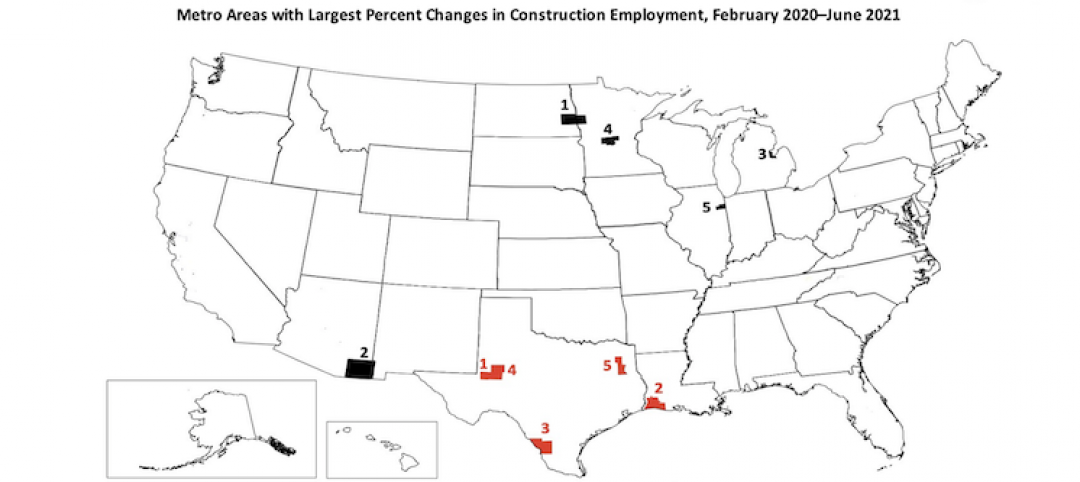
Construction employment lags or matches pre-pandemic level in 101 metro areas despite housing boom
Eighty metro areas had lower construction employment in June 2021 than February 2020.
Market Data | Jul 28, 2021
Marriott has the largest construction pipeline of U.S. franchise companies in Q2‘21
472 new hotels with 59,034 rooms opened across the United States during the first half of 2021.
Market Data | Jul 27, 2021
New York leads the U.S. hotel construction pipeline at the close of Q2‘21
Many hotel owners, developers, and management groups have used the operational downtime, caused by COVID-19’s impact on operating performance, as an opportunity to upgrade and renovate their hotels and/or redefine their hotels with a brand conversion.
Market Data | Jul 26, 2021
U.S. construction pipeline continues along the road to recovery
During the first and second quarters of 2021, the U.S. opened 472 new hotels with 59,034 rooms.
Market Data | Jul 21, 2021
Architecture Billings Index robust growth continues
AIA’s Architecture Billings Index (ABI) score for June remained at an elevated level of 57.1.
Market Data | Jul 20, 2021
Multifamily proposal activity maintains sizzling pace in Q2
Condos hit record high as all multifamily properties benefit from recovery.


