

Grumman/Butkus Associates, a firm of energy efficiency consultants and sustainable design engineers, recently released the results of its 2016 Hospital Energy and Water Benchmarking Survey, focusing on healthcare facilities’ resource usage trends and costs for calendar year 2015.
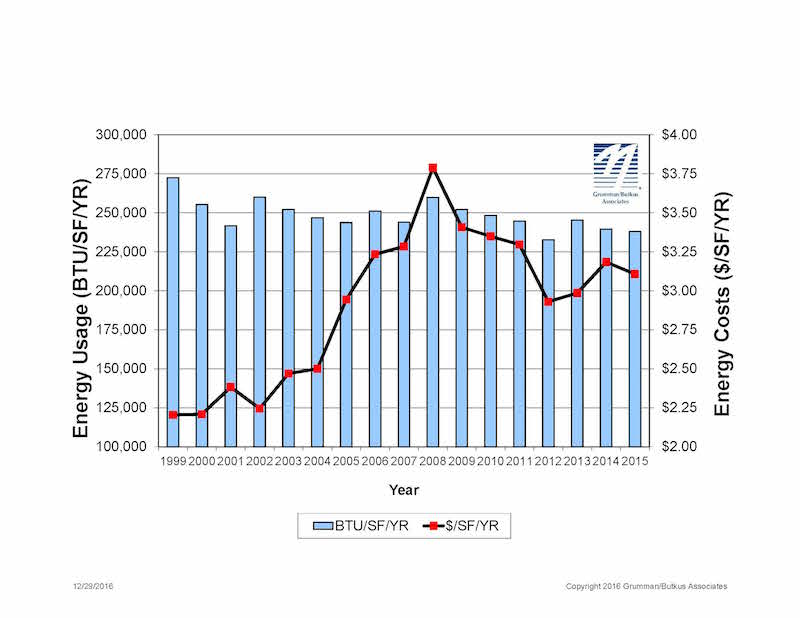
Since G/BA initiated the survey more than 20 years ago, hospitals’ overall fossil fuel use has trended downward, but electricity use isn’t declining as much. The average combined Btu/ft2 (electricity plus gas/steam) for participating facilities was 237,998 in CY2015, slightly down from 239,591 in CY2014.
Square-foot prices for gas/steam were down significantly year-to-year ($0.82 in 2015, compared with $1.02 in 2014), but square-foot prices for electricity rose ($2.28 in 2015, vs. $2.16 in 2014). The overall result is that hospitals’ total ft2 costs for energy (gas/steam plus electric) declined: $3.11 for 2015, compared with $3.18 for 2014.
Hospitals’ average carbon footprint has remained fairly steady at about 60 pounds of CO2 equivalent per ft2 per year since G/BA began calculating carbon data in 1999. “If we are going to address the very daunting issue of climate change, the healthcare industry must make greater strides in reducing its carbon footprint,” says Dan Doyle, G/BA Chairman. “As the trend data shows, not enough progress is being made so far.”
Participating facilities displayed a broad range of usage patterns. For instance, some participants are using more than 200,000 BTU/ft2 in fossil fuel annually, compared with a general mid-range of facilities (about 130,000 BTU/ft2/year) and those that used least (75,000 BTU/ft2/year or less). Similarly, a few hospitals consume more than 40 kWh/ft2/year in electricity, compared with a mid-range of about 25 kWh/ft2/year. A few squeaked by with less than 18 kWh/ft2.
“Facilities that have high unit costs for energy should view this as an opportunity,” says Doyle. “For example, an energy conservation project that would have a five-year payback at an ‘average’ facility may have a payback of just 2.5 or 3 years at a facility with higher unit costs for energy.”
Hospital water/sewer use is also gradually declining, currently averaging about 45 gallons per square foot per year (compared with nearly 70 gallons/ ft2/year a decade ago). Costs for water/sewer are rising, however, now averaging $0.39/ft2. As recently as 2007, hospitals were paying about $0.27/ft2. “G/BA expects the trend of rising water and sewer costs to continue,” says Doyle. “Price hikes not only reflect increasing costs to extract and treat the water, but also the fact that cash-strapped governmental entities may view water as a revenue source.”
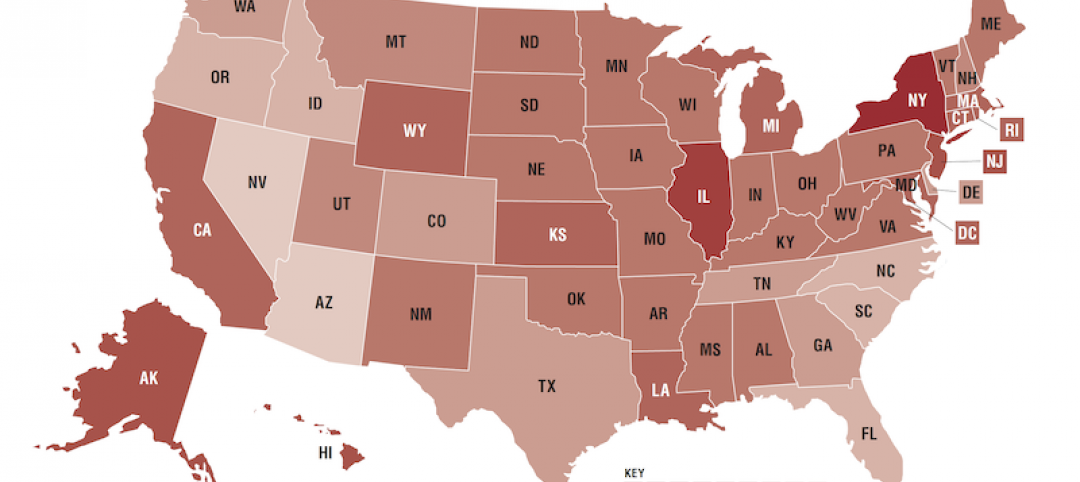
Since 1995, the G/BA survey has provided a free annual benchmarking resource. Hospitals are invited to participate by submitting responses to a short list of questions. Information for this edition was provided by 137 hospitals located in Illinois (56), Wisconsin (31), Michigan (29), Indiana (10), and six other states.
Full results and analysis, as well as information about participating in the 2017 survey (2016 data), are available at the firm’s website: grummanbutkus.com/HES. For additional information, contact Dan Doyle (ddoyle@grummanbutkus.com) or Julie Higginbotham (jhigginbotham@grummanbutkus.c
Related Stories

Market Data | Nov 22, 2019
Architecture Billings Index rebounds after two down months
The Architecture Billings Index (ABI) score in October is 52.0.

Market Data | Nov 14, 2019
Construction input prices unchanged in October
Nonresidential construction input prices fell 0.1% for the month and are down 2.0% compared to the same time last year.

Multifamily Housing | Nov 7, 2019
Multifamily construction market remains strong heading into 2020
Fewer than one in 10 AEC firms doing multifamily work reported a decrease in proposal activity in Q3 2019, according to a PSMJ report.
Market Data | Nov 5, 2019
Construction and real estate industry deals in September 2019 total $21.7bn globally
In terms of number of deals, the sector saw a drop of 4.4% over the last 12-month average.

Market Data | Nov 4, 2019
Nonresidential construction spending rebounds slightly in September
Private nonresidential spending fell 0.3% on a monthly basis and is down 5.7% compared to the same time last year.

Market Data | Nov 1, 2019
GDP growth expands despite reduction in nonresident investment
The annual rate for nonresidential fixed investment in structures declined 15.3% in the third quarter.

Market Data | Oct 24, 2019
Architecture Billings Index downturn moderates as challenging conditions continue
The Architecture Billings Index (ABI) score in September is 49.7.

Market Data | Oct 23, 2019
ABC’s Construction Backlog Indicator rebounds in August
The primary issue for most contractors is not a lack of demand, but an ongoing and worsening shortage of skilled workers available to meet contractual requirements.

Multifamily Housing | Oct 16, 2019
A new study wonders how many retiring adults will be able to afford housing
Harvard’s Joint Center for Housing Studies focuses on growing income disparities among people 50 or older.
Market Data | Oct 9, 2019
Two ULI reports foresee a solid real estate market through 2021
Market watchers, though, caution about a “surfeit” of investment creating a bubble.


