

Grumman/Butkus Associates, a firm of energy efficiency consultants and sustainable design engineers, recently released the results of its 2016 Hospital Energy and Water Benchmarking Survey, focusing on healthcare facilities’ resource usage trends and costs for calendar year 2015.
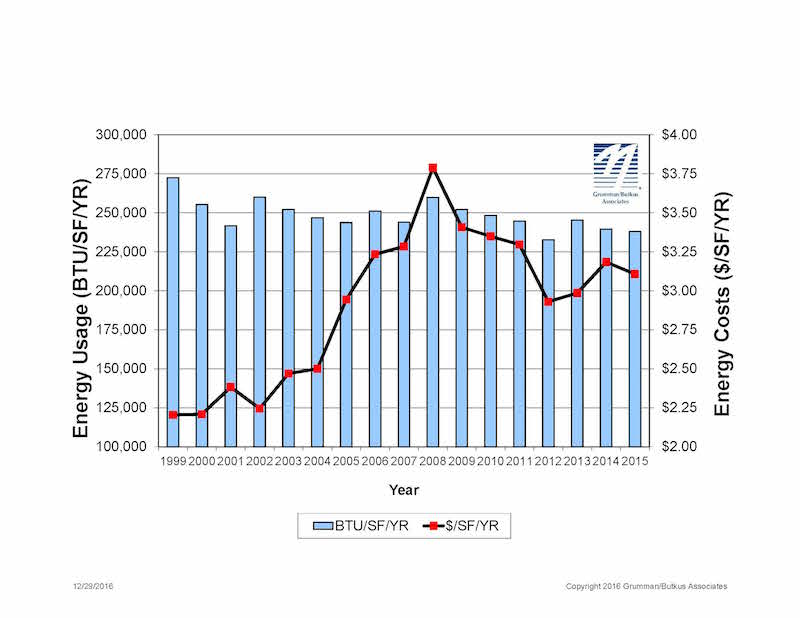
Since G/BA initiated the survey more than 20 years ago, hospitals’ overall fossil fuel use has trended downward, but electricity use isn’t declining as much. The average combined Btu/ft2 (electricity plus gas/steam) for participating facilities was 237,998 in CY2015, slightly down from 239,591 in CY2014.
Square-foot prices for gas/steam were down significantly year-to-year ($0.82 in 2015, compared with $1.02 in 2014), but square-foot prices for electricity rose ($2.28 in 2015, vs. $2.16 in 2014). The overall result is that hospitals’ total ft2 costs for energy (gas/steam plus electric) declined: $3.11 for 2015, compared with $3.18 for 2014.
Hospitals’ average carbon footprint has remained fairly steady at about 60 pounds of CO2 equivalent per ft2 per year since G/BA began calculating carbon data in 1999. “If we are going to address the very daunting issue of climate change, the healthcare industry must make greater strides in reducing its carbon footprint,” says Dan Doyle, G/BA Chairman. “As the trend data shows, not enough progress is being made so far.”
Participating facilities displayed a broad range of usage patterns. For instance, some participants are using more than 200,000 BTU/ft2 in fossil fuel annually, compared with a general mid-range of facilities (about 130,000 BTU/ft2/year) and those that used least (75,000 BTU/ft2/year or less). Similarly, a few hospitals consume more than 40 kWh/ft2/year in electricity, compared with a mid-range of about 25 kWh/ft2/year. A few squeaked by with less than 18 kWh/ft2.
“Facilities that have high unit costs for energy should view this as an opportunity,” says Doyle. “For example, an energy conservation project that would have a five-year payback at an ‘average’ facility may have a payback of just 2.5 or 3 years at a facility with higher unit costs for energy.”
Hospital water/sewer use is also gradually declining, currently averaging about 45 gallons per square foot per year (compared with nearly 70 gallons/ ft2/year a decade ago). Costs for water/sewer are rising, however, now averaging $0.39/ft2. As recently as 2007, hospitals were paying about $0.27/ft2. “G/BA expects the trend of rising water and sewer costs to continue,” says Doyle. “Price hikes not only reflect increasing costs to extract and treat the water, but also the fact that cash-strapped governmental entities may view water as a revenue source.”
Since 1995, the G/BA survey has provided a free annual benchmarking resource. Hospitals are invited to participate by submitting responses to a short list of questions. Information for this edition was provided by 137 hospitals located in Illinois (56), Wisconsin (31), Michigan (29), Indiana (10), and six other states.
Full results and analysis, as well as information about participating in the 2017 survey (2016 data), are available at the firm’s website: grummanbutkus.com/HES. For additional information, contact Dan Doyle (ddoyle@grummanbutkus.com) or Julie Higginbotham (jhigginbotham@grummanbutkus.c
Related Stories
Market Data | Oct 4, 2019
Global construction output growth will decline to 2.7% in 2019
It will be the slowest pace of growth in a decade, according to GlobalData.

Market Data | Oct 2, 2019
Spending on nonresidential construction takes a step back in August
Office, healthcare, and public safety are among the fastest-growing sectors, according to the U.S. Census Bureau's latest report.
Market Data | Sep 27, 2019
The global hotel construction pipeline ascends to new record highs
With the exception of Latin America, all regions of the globe either continued to set record high pipeline counts or have already settled into topping-out formations amidst concerns of a worldwide economic slowdown.
Market Data | Sep 25, 2019
Senate introduces The School Safety Clearinghouse Act
Legislation would create a federally funded and housed informational resource on safer school designs.
Market Data | Sep 18, 2019
Substantial decline in Architecture Billings
August report suggests greatest weakness in design activity in several years.

Market Data | Sep 17, 2019
ABC’s Construction Backlog Indicator inches lower in July
Backlog in the heavy industrial category increased by 2.3 months and now stands at its highest level in the history of the CBI series.

Market Data | Sep 13, 2019
Spending on megaprojects, already on the rise, could spike hard in the coming years
A new FMI report anticipates that megaprojects will account for one-fifth of annual construction spending within the next decade.

Architects | Sep 11, 2019
Buoyed by construction activity, architect compensation continues to see healthy gains
The latest AIA report breaks down its survey data by 44 positions and 28 metros.

Market Data | Sep 11, 2019
New 2030 Commitment report findings emphasize need for climate action
Profession must double down on efforts to meet 2030 targets.

Market Data | Sep 10, 2019
Apartment buildings and their residents contribute $3.4 trillion to the national economy
New data show how different aspects of the apartment industry positively impact national, state and local economies.


