Leopardo released its 2016 Construction Economics Report and Outlook, a guide to help business leaders, healthcare administrators and government decision-makers understand the factors that impact construction costs.
This year’s report shows that 2015 was a turning point for commercial real estate construction, as spending reached the highest level since the Great Recession and even the pace of growth accelerated more than in previous years.
By the end of 2015, total spending on U.S. construction grew 10.5% to $1.1 trillion, the largest year-over-year gain since 2007. The most dynamic growth was in the private sector, where construction spending expanded 12.3%, compared to just 5.6% growth in public-sector projects.
"With a steadily growing economy, low national vacancy rates and historically low interest rates, companies are seeing this period as the right time to expand or relocate their facilities to accommodate growth,” said Jim Leopardo, CEO of Leopardo. “We’re seeing healthy construction volume of nearly every property type, both nationally and in the Chicago area.”
Key findings in the report include:
- Multifamily construction has grown by 29.4% annually since 2011, driven by a movement of renters by choice in urban work-live-play areas. In the same period, single-family home construction increased 14.8% annually.
- Office construction spending grew by 22% in 2014, driven by job growth in the tech sector. This growth spurt is expected to scale back to an average 5.9% annual growth rate through 2019.
- Construction jobs grew 7.8% in the Chicago area, outpacing the national average of 4.2% in 2015. In 2014, Chicago’s 3.2% construction job growth lagged the national average of 5.7%.
Related Stories
Market Data | Nov 22, 2021
Only 16 states and D.C. added construction jobs since the pandemic began
Texas, Wyoming have worst job losses since February 2020, while Utah, South Dakota add the most.
Market Data | Nov 10, 2021
Construction input prices see largest monthly increase since June
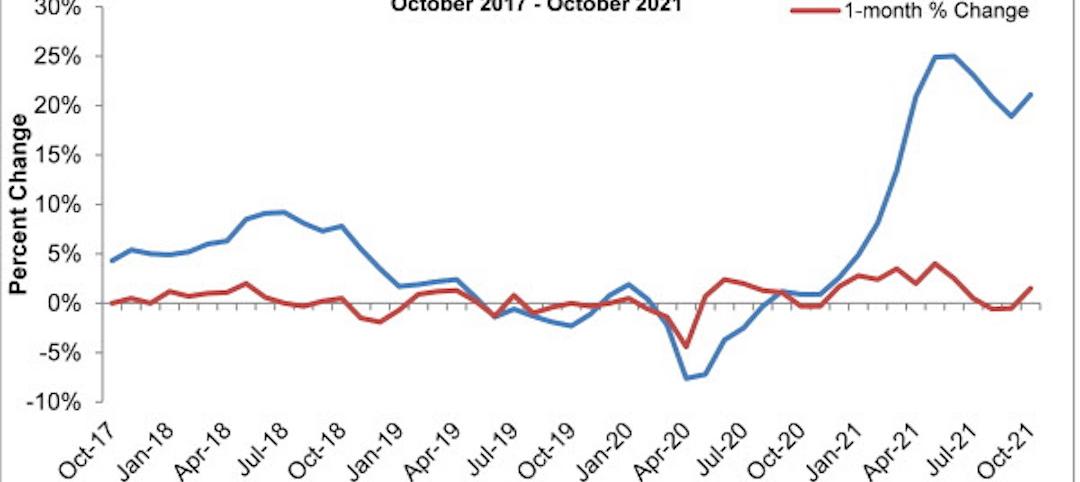
Construction input prices are 21.1% higher than in October 2020.
Market Data | Nov 9, 2021
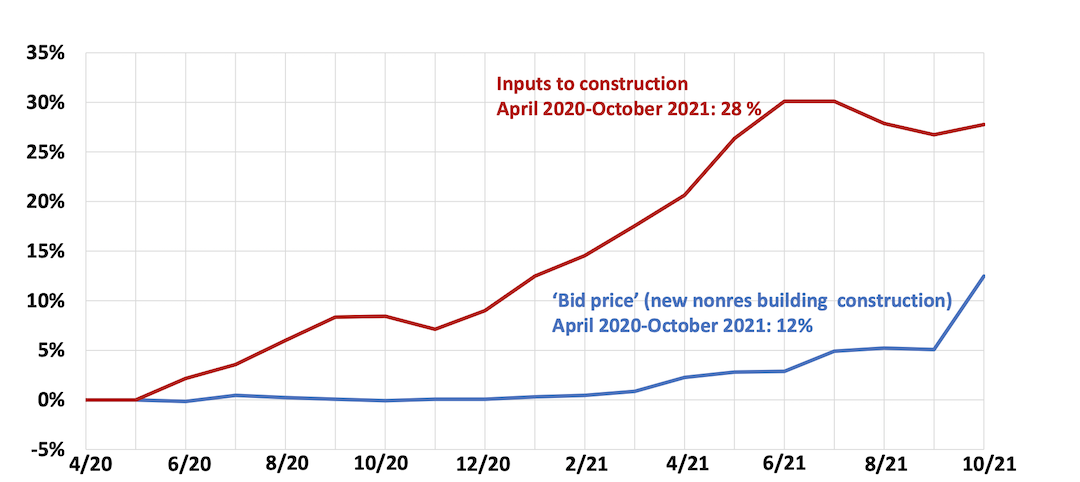
Continued increases in construction materials prices starting to drive up price of construction projects
Supply chain and labor woes continue.
Market Data | Nov 5, 2021
Construction firms add 44,000 jobs in October
Gain occurs even as firms struggle with supply chain challenges.
Market Data | Nov 3, 2021
One-fifth of metro areas lost construction jobs between September 2020 and 2021
Beaumont-Port Arthur, Texas and Sacramento--Roseville--Arden-Arcade Calif. top lists of gainers.
Market Data | Nov 2, 2021
Construction spending slumps in September
A drop in residential work projects adds to ongoing downturn in private and public nonresidential.
Hotel Facilities | Oct 28, 2021
Marriott leads with the largest U.S. hotel construction pipeline at Q3 2021 close
In the third quarter alone, Marriott opened 60 new hotels/7,882 rooms accounting for 30% of all new hotel rooms that opened in the U.S.
Hotel Facilities | Oct 28, 2021
At the end of Q3 2021, Dallas tops the U.S. hotel construction pipeline
The top 25 U.S. markets account for 33% of all pipeline projects and 37% of all rooms in the U.S. hotel construction pipeline.
Market Data | Oct 27, 2021
Only 14 states and D.C. added construction jobs since the pandemic began
Supply problems, lack of infrastructure bill undermine recovery.
Market Data | Oct 26, 2021
U.S. construction pipeline experiences highs and lows in the third quarter
Renovation and conversion pipeline activity remains steady at the end of Q3 ‘21, with conversion projects hitting a cyclical peak, and ending the quarter at 752 projects/79,024 rooms.


