Leopardo released its 2016 Construction Economics Report and Outlook, a guide to help business leaders, healthcare administrators and government decision-makers understand the factors that impact construction costs.
This year’s report shows that 2015 was a turning point for commercial real estate construction, as spending reached the highest level since the Great Recession and even the pace of growth accelerated more than in previous years.
By the end of 2015, total spending on U.S. construction grew 10.5% to $1.1 trillion, the largest year-over-year gain since 2007. The most dynamic growth was in the private sector, where construction spending expanded 12.3%, compared to just 5.6% growth in public-sector projects.
"With a steadily growing economy, low national vacancy rates and historically low interest rates, companies are seeing this period as the right time to expand or relocate their facilities to accommodate growth,” said Jim Leopardo, CEO of Leopardo. “We’re seeing healthy construction volume of nearly every property type, both nationally and in the Chicago area.”
Key findings in the report include:
- Multifamily construction has grown by 29.4% annually since 2011, driven by a movement of renters by choice in urban work-live-play areas. In the same period, single-family home construction increased 14.8% annually.
- Office construction spending grew by 22% in 2014, driven by job growth in the tech sector. This growth spurt is expected to scale back to an average 5.9% annual growth rate through 2019.
- Construction jobs grew 7.8% in the Chicago area, outpacing the national average of 4.2% in 2015. In 2014, Chicago’s 3.2% construction job growth lagged the national average of 5.7%.
Related Stories
Market Data | Sep 20, 2021
August construction employment lags pre-pandemic peak in 39 states
The coronavirus delta variant and supply problems hold back recovery.
Market Data | Sep 15, 2021
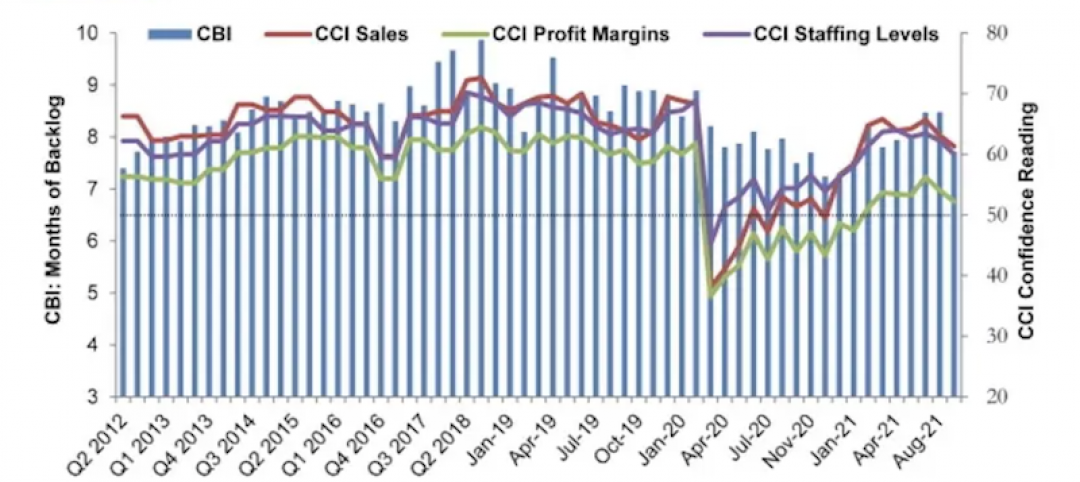
ABC’s Construction Backlog Indicator plummets in August; Contractor Confidence down
ABC’s Construction Confidence Index readings for sales, profit margins and staffing levels all fell modestly in August.
Market Data | Sep 7, 2021
Construction sheds 3,000 jobs in August
Gains are limited to homebuilding as other contractors struggle to fill both craft and salaried positions.
Market Data | Sep 3, 2021
Construction workforce shortages reach pre-pandemic levels
Coronavirus continues to impact projects and disrupt supply chains.
Multifamily Housing | Sep 1, 2021
Top 10 outdoor amenities at multifamily housing developments for 2021
Fire pits, lounge areas, and covered parking are the most common outdoor amenities at multifamily housing developments, according to new research from Multifamily Design+Construction.
Market Data | Sep 1, 2021
Construction spending posts small increase in July
Coronavirus, soaring costs, and supply disruptions threaten to erase further gains.
Market Data | Sep 1, 2021
Bradley Corp. survey finds office workers taking coronavirus precautions
Due to the rise in new strains of the virus, 70% of office workers have implemented a more rigorous handwashing regimen versus 59% of the general population.
Market Data | Aug 31, 2021
Three out of four metro areas add construction jobs from July 2020 to July 2021
COVID, rising costs, and supply chain woes may stall gains.
Market Data | Aug 24, 2021
July construction employment lags pre-pandemic peak in 36 states
Delta variant of coronavirus threatens to hold down further gains.
Market Data | Aug 17, 2021
Demand for design activity continues to expand
The ABI score for July was 54.6.


