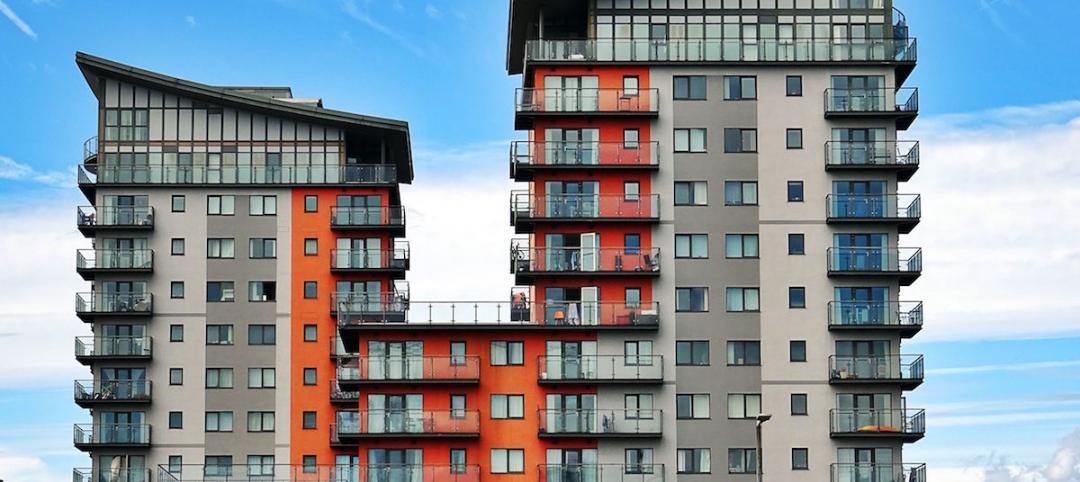
Since the beginning of the pandemic, rents have only varied by a few dollars each month – contrary to what many experts initially feared. However, there are significant rent variations at the metro level, and given a lack of government stimulus and continuing layoffs, the fall and winter months will be telling, says the latest Yardi Matrix® National Multifamily Report.
“With the extreme uncertainty surrounding the country today, the multifamily industry has held up better so far than many predicted. Since the beginning of the pandemic, overall rents have only been up or down by a few dollars each month. Many initially feared that the decline would be much steeper than the $8 overall national rent decline we have seen since February,” states the report.
According to the National Multifamily Housing Council’s Rent Payment Tracker, 92.2% of apartment households made a full or partial rent payment by September 27—a 1.5 percentage point decline from September 2019 and a 0.1 percentage point increase from August 2020.
Rents decreased 0.3% in September on a year-over-year basis, continuing a trend since the onset of the pandemic: Metros with the highest rents have suffered the most, while less expensive metros have fared better than expected. San Jose (-6.6%) and San Francisco (-5.8%) led with the sharpest year-over-year declines yet again. Austin (-2.9%) moved up to tie with Boston (-2.9%) for third place in largest YoY declines.
Dive deeper into the full September National Multifamily Report.
Related Stories
Contractors | Jan 4, 2018
Construction spending in a ‘mature’ period of incremental growth
Labor shortages are spiking wages. Materials costs are rising, too.
Market Data | Dec 20, 2017
Architecture billings upturn shows broad strength
The American Institute of Architects (AIA) reported the November ABI score was 55.0, up from a score of 51.7 in the previous month.
Market Data | Dec 14, 2017
ABC chief economist predicts stable 2018 construction economy
There are risks to the 2018 outlook as a number of potential cost increases could come into play.
Market Data | Dec 13, 2017
Top world regions and markets in the global hotel construction pipeline
The top world region by project count is North America.
Market Data | Dec 11, 2017
Global hotel construction pipeline is growing
The Total Pipeline stands at 12,427 Projects/2,084,940 Rooms.
Market Data | Dec 11, 2017
Construction backlog surges, sets record in third quarter
CBI is a leading economic indicator that reflects the amount of construction work under contract, but not yet completed.
Market Data | Dec 7, 2017
Buoyed by healthy economy, ABC Index finds contractors upbeat
Despite rising construction labor and materials costs, 55% of contractors expect their profit margins to expand in the first half of 2018.
Market Data | Dec 5, 2017
Top health systems engaged in $21 billion of U.S. construction projects
Largest active projects are by Sutter Health, New York Presbyterian, and Scripps Health.
Industry Research | Nov 28, 2017
2018 outlook: Economists point to slowdown, AEC professionals say ‘no way’
Multifamily housing and senior living developments head the list of the hottest sectors heading into 2018, according a survey of 356 AEC professionals.
Market Data | Nov 27, 2017
Construction's contribution to U.S. economy highest in seven years
Thirty-seven states benefited from the rise in construction activity in their state, while 13 states experienced a reduction in activity.


