Since the beginning of the pandemic, rents have only varied by a few dollars each month – contrary to what many experts initially feared. However, there are significant rent variations at the metro level, and given a lack of government stimulus and continuing layoffs, the fall and winter months will be telling, says the latest Yardi Matrix® National Multifamily Report.
“With the extreme uncertainty surrounding the country today, the multifamily industry has held up better so far than many predicted. Since the beginning of the pandemic, overall rents have only been up or down by a few dollars each month. Many initially feared that the decline would be much steeper than the $8 overall national rent decline we have seen since February,” states the report.
According to the National Multifamily Housing Council’s Rent Payment Tracker, 92.2% of apartment households made a full or partial rent payment by September 27—a 1.5 percentage point decline from September 2019 and a 0.1 percentage point increase from August 2020.
Rents decreased 0.3% in September on a year-over-year basis, continuing a trend since the onset of the pandemic: Metros with the highest rents have suffered the most, while less expensive metros have fared better than expected. San Jose (-6.6%) and San Francisco (-5.8%) led with the sharpest year-over-year declines yet again. Austin (-2.9%) moved up to tie with Boston (-2.9%) for third place in largest YoY declines.
Dive deeper into the full September National Multifamily Report.
Related Stories
Market Data | Apr 4, 2016
ABC: Nonresidential spending slip in February no cause for alarm
Spending in the nonresidential sector totaled $690.3 billion on a seasonally adjusted, annualized basis in February. The figure is a step back but still significantly higher than one year ago.
Market Data | Mar 30, 2016
10 trends for commercial real estate: JLL report
The report looks at global threats and opportunities, and how CRE firms are managing their expectations for growth.
Market Data | Mar 23, 2016
AIA: Modest expansion for Architecture Billings Index
Business conditions softening most in Midwest in recent months.
Retail Centers | Mar 16, 2016
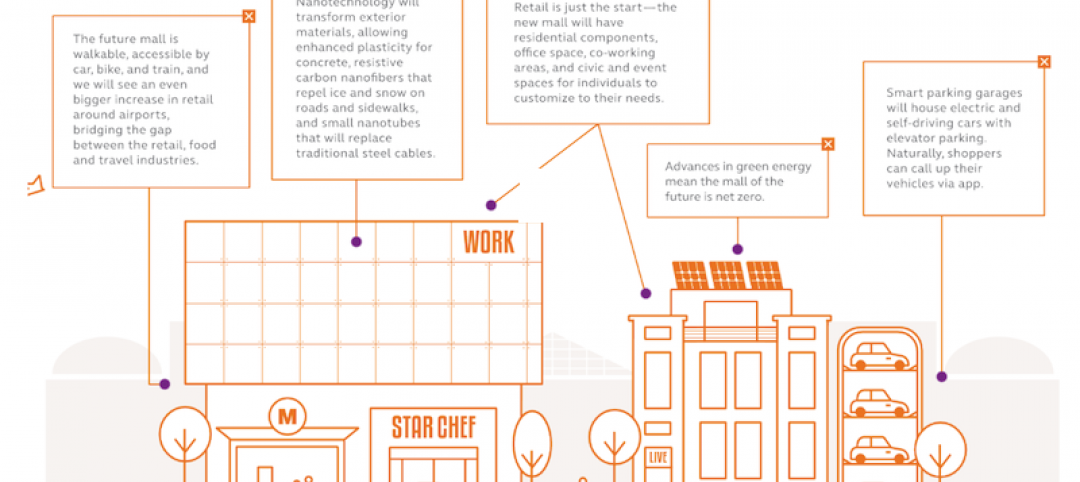
Food and technology will help tomorrow’s malls survive, says CallisonRTKL
CallisonRTKL foresees future retail centers as hubs with live/work/play components.
Market Data | Mar 6, 2016
Real estate execs measure success by how well they manage ‘talent,’ costs, and growth
A new CBRE survey finds more companies leaning toward “smarter” workspaces.
Market Data | Mar 1, 2016
ABC: Nonresidential spending regains momentum in January
Nonresidential construction spending expanded 2.5% on a monthly basis and 12.3% on a yearly basis, totaling $701.9 billion. Spending increased in January in 10 of 16 nonresidential construction sectors.
Market Data | Mar 1, 2016
Leopardo releases 2016 Construction Economics Report
This year’s report shows that spending in 2015 reached the highest level since the Great Recession. Total spending on U.S. construction grew 10.5% to $1.1 trillion, the largest year-over-year gain since 2007.
Market Data | Feb 26, 2016
JLL upbeat about construction through 2016
Its latest report cautions about ongoing cost increases related to finding skilled laborers.
Market Data | Feb 17, 2016
AIA reports slight contraction in Architecture Billings Index
Multifamily residential sector improving after sluggish 2015.
Market Data | Feb 11, 2016
AIA: Continued growth expected in nonresidential construction
The American Institute of Architects’ semi-annual Consensus Construction Forecast indicates a growth of 8% in construction spending in 2016, and 6.7% the following year.


