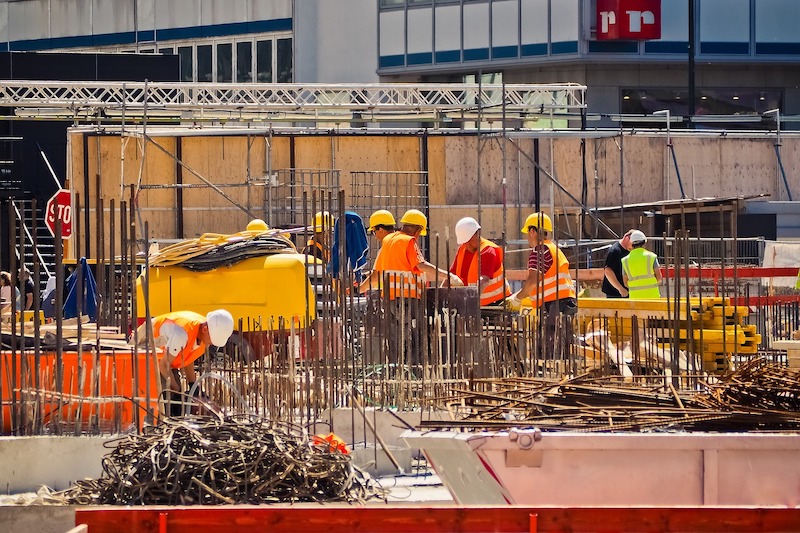
The Marcum Commercial Construction Index highlights the continued spending weakness in nonresidential construction during the first nine months of the year and points to a significant anticipated change beginning in 2017. The change is being attributed to the major infrastructure-led stimulus package expected from the new Presidential administration. The national Construction Industry Practice group of Marcum LLP, a top national accounting and advisory firm, produces the quarterly index.
Overall nonresidential construction spending in September totaled $690.5 billion, down a slight 0.7 percent from a year earlier. Of the category’s 16 subsectors, bright spots included Office-related spending, which registered a whopping 23% gain to $70.7 billion; Lodging, up 20% year-over-year to $28.8 billion; Commercial construction, with a 6% gain to $71.7 billion; Amusement & Recreation, up 3.5% to $21.4 billion; and Educational construction, at $87.1 billion, a 3.3% percent increase.
The remaining 11 nonresidential subsectors all recorded fall-offs for the month, with the greatest declines in Sewage & Waste Disposal (-18.8%), Water Supply (-13.7%), Communication (-12.6%) and Transportation (-11.3%).
“Most construction firms report intense difficulty securing electricians, heating/cooling professionals, welders and carpenters, among others,” says Anirban Basu, Marcum’s Chief Construction Economist, in a press release. The construction worker unemployment rate in October was less than half of what it was five years ago, down to 5.7 % from 13.7 % in the same month of 2011. This compares to a national unemployment rate of 4.9% at the end of the 2016 third quarter.
Looking ahead, the Marcum report predicts that a stimulus package will put pressure on wages and inflation and lead to higher interest rates, which in turn will eventually hurt construction spending. “After a period of relatively intense construction spending due in part to a stimulus package, the nonresidential sector could face a sharp slowdown in construction spending thereafter,” it states.
For the complete Marcum Commercial Construction Index, visit www.marcumllp.com/industries/construction.
Related Stories
Market Data | Aug 15, 2018
National asking rents for office space rise again
The rise in rental rates marks the 21st consecutive quarterly increase.
Market Data | Aug 13, 2018
First Half 2018 commercial and multifamily construction starts show mixed performance across top metropolitan areas
Gains reported in five of the top ten markets.
Market Data | Aug 10, 2018
Construction material prices inch down in July
Nonresidential construction input prices increased fell 0.3% in July but are up 9.6% year over year.
Market Data | Aug 9, 2018
Projections reveal nonresidential construction spending to grow
AIA releases latest Consensus Construction Forecast.
Market Data | Aug 7, 2018
New supply's impact illustrated in Yardi Matrix national self storage report for July
The metro with the most units under construction and planned as a percent of existing inventory in mid-July was Nashville, Tenn.
Market Data | Aug 3, 2018
U.S. multifamily rents reach new heights in July
Favorable economic conditions produce a sunny summer for the apartment sector.
Market Data | Aug 2, 2018
Nonresidential construction spending dips in June
“The hope is that June’s construction spending setback is merely a statistical aberration,” said ABC Chief Economist Anirban Basu.
Market Data | Aug 1, 2018
U.S. hotel construction pipeline continues moderate growth year-over-year
The hotel construction pipeline has been growing moderately and incrementally each quarter.
Market Data | Jul 30, 2018
Nonresidential fixed investment surges in second quarter
Nonresidential fixed investment represented an especially important element of second quarter strength in the advance estimate.
Market Data | Jul 11, 2018
Construction material prices increase steadily in June
June represents the latest month associated with rapidly rising construction input prices.


