In the second quarter of 2021, analysts at Lodging Econometrics (LE) report that the top franchise companies with the largest construction pipelines are: Marriott International with 1,301 projects/170,847 rooms, Hilton Worldwide with 1,216 projects/139,172 rooms, and InterContinental Hotels Group (IHG) with 777 projects/78,929 rooms. Development projects with these three franchise companies comprise 69% of all projects in the total construction pipeline.
The largest brands for each of these companies are Marriott’s Fairfield Inn with 257 projects/25,051 rooms, Hilton’s Home2 Suites by Hilton, with 379 projects/39,584 rooms and IHG’s Holiday Inn Express with 303 projects/29,055 rooms. These three brands make up 20% of the total construction pipeline rooms in the U.S.
Other high-volume brands in the pipeline for each of these franchises are Marriott’s TownePlace Suites with 198 projects/19,422 rooms and Residence Inn with 189 projects/23,493 rooms; Hilton’s Hampton by Hilton with 269 projects/28,071 rooms and Tru by Hilton with 235 projects/22,521 rooms; and IHG’s Avid Hotel with 157 projects/13,842 rooms and Staybridge Suites with 122 projects/12,607 rooms.
In the second quarter of 2021, LE recorded 583 conversion projects/63,807 rooms. Of these conversion totals, Best Western leads with 116 conversion projects/10,289 rooms, accounting for 20% of the conversion pipeline by projects. Following Best Western is Choice Hotels, Marriott International, and Hilton Worldwide. Best Western and these three franchise companies combined account for 61% of all the rooms in the conversion pipeline across the United States.
472 new hotels with 59,034 rooms opened across the United States during the first half of 2021. Marriott, Hilton, and IHG collectively opened 74% of the hotels. Marriott opened 152 hotels with 20,416 rooms, Hilton opened 125 hotels/16,970 rooms, and IHG opened 72 hotels/7,249 rooms.
Related Stories
Market Data | Apr 4, 2016
ABC: Nonresidential spending slip in February no cause for alarm
Spending in the nonresidential sector totaled $690.3 billion on a seasonally adjusted, annualized basis in February. The figure is a step back but still significantly higher than one year ago.
Market Data | Mar 30, 2016
10 trends for commercial real estate: JLL report
The report looks at global threats and opportunities, and how CRE firms are managing their expectations for growth.
Market Data | Mar 23, 2016
AIA: Modest expansion for Architecture Billings Index
Business conditions softening most in Midwest in recent months.
Retail Centers | Mar 16, 2016
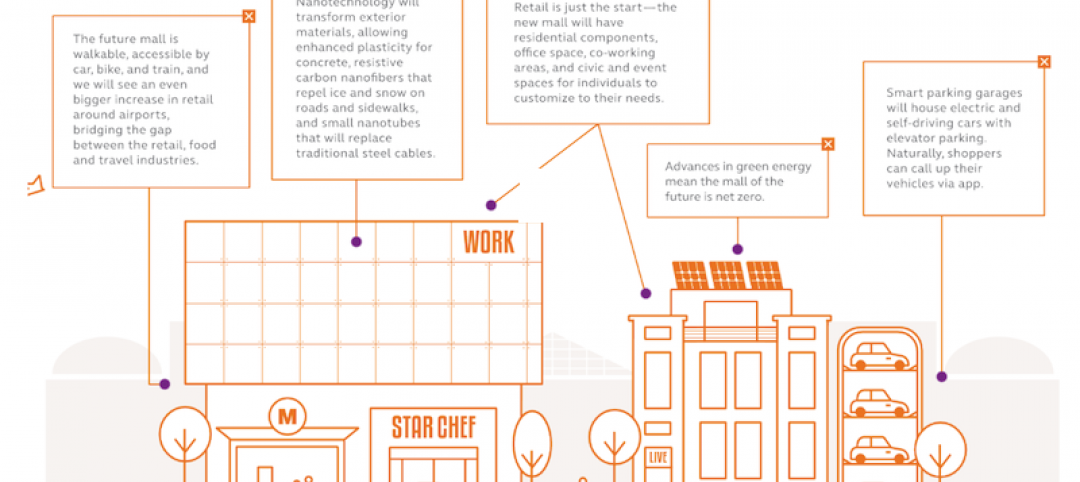
Food and technology will help tomorrow’s malls survive, says CallisonRTKL
CallisonRTKL foresees future retail centers as hubs with live/work/play components.
Market Data | Mar 6, 2016
Real estate execs measure success by how well they manage ‘talent,’ costs, and growth
A new CBRE survey finds more companies leaning toward “smarter” workspaces.
Market Data | Mar 1, 2016
ABC: Nonresidential spending regains momentum in January
Nonresidential construction spending expanded 2.5% on a monthly basis and 12.3% on a yearly basis, totaling $701.9 billion. Spending increased in January in 10 of 16 nonresidential construction sectors.
Market Data | Mar 1, 2016
Leopardo releases 2016 Construction Economics Report
This year’s report shows that spending in 2015 reached the highest level since the Great Recession. Total spending on U.S. construction grew 10.5% to $1.1 trillion, the largest year-over-year gain since 2007.
Market Data | Feb 26, 2016
JLL upbeat about construction through 2016
Its latest report cautions about ongoing cost increases related to finding skilled laborers.
Market Data | Feb 17, 2016
AIA reports slight contraction in Architecture Billings Index
Multifamily residential sector improving after sluggish 2015.
Market Data | Feb 11, 2016
AIA: Continued growth expected in nonresidential construction
The American Institute of Architects’ semi-annual Consensus Construction Forecast indicates a growth of 8% in construction spending in 2016, and 6.7% the following year.


