


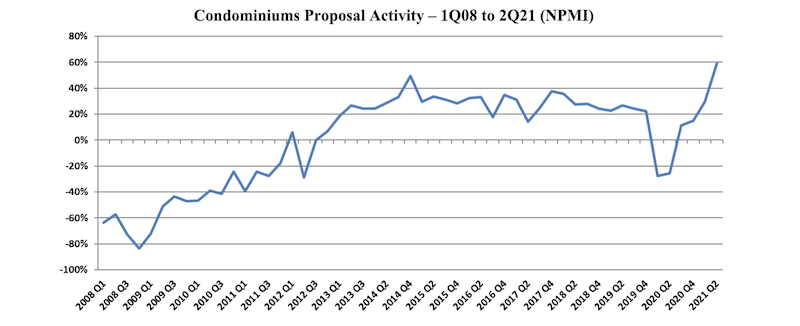
Proposal activity for Multifamily-for-Rent (Apartments) and Condominium properties continued to exceed historic norms, with Condos achieving its highest level since PSMJ Resources began tracking submarkets in its Quarterly Market Forecast (QMF) of A/E/C firm leaders. Apartments, which recorded its third-highest NPMI of 71% in the 1st Quarter, repeated that score in the 2nd Quarter.
While 61% of respondents working in the Condo market reported an increase in proposal activity from the 1st Quarter to the 2nd Quarter, only 2% saw a decline. This net plus/minus index (NPMI) of 59% exceeded the previous high for Condos of 49% achieved in the 4th Quarter of 2014.
Second-quarter proposal activity for Apartments continued to outpace all other submarkets in the Housing sector and all but one (Product Manufacturing) of the 58 submarkets measured across all construction sectors. A full three-quarters of the A/E/C firm leaders responding to PSMJ’s quarterly survey said that Multifamily proposal opportunities grew in the 2nd Quarter compared with only 4% who reported a decline.
The NPMI expresses the difference between the percentage of PSMJ member firms reporting an increase in proposal activity and those reporting a decrease. The QMF has proven to be a solid predictor of market health for 12 major markets served by the A/E/C industry since its inception in 2003, and for 58 submarkets since 2006.
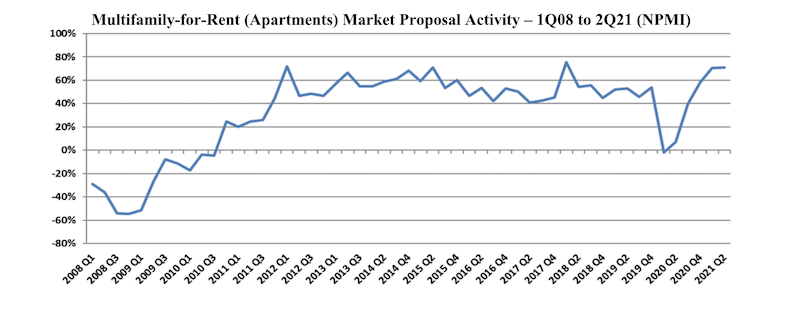
The record-high NPMI for Apartments was 76% in the 1st Quarter of 2018, followed by 72% in the 1st Quarter of 2012 and 71% in the 1st Quarters of 2015 and 2021.
PSMJ Senior Principal David Burstein, PE, AECPM, says the future strength of the housing market relies heavily on the ability of state and federal government agencies to invest adequately in infrastructure. “The condo and apartment markets have been on fire for several years, resulting in a lot of new multifamily housing,” says Burstein. “This is now creating traffic and other congestion problems which, if not dealt with by the cognizant government agencies, may cause the multifamily market to slow down in the coming quarters. So it is important to continue tracking the PSMJ NPMI over the next few quarters to spot any emerging slowdowns.”
The Assisted/Independent Senior Living submarket leveled off to an NPMI of 49%, down 10 NPMI percentage points from the 1st Quarter. While 51% of respondents reported an increase in proposal activity, only 2% saw a drop and the remaining 47% said opportunities were flat.
The two other Housing submarkets measured in the PSMJ survey remained strong. The Housing Subdivision market recorded an NPMI of 68% for a second straight month, as not a single respondent in the 2nd Quarter survey reported a decline in proposal opportunities. Single-Family Homes also repeated its 1st Quarter NPMI; the 51% index score once again tied for its second-highest level since the inception of submarket data tracking in the QMF.
PSMJ Resources, a consulting and publishing company dedicated to the A/E/C industry, has conducted its Quarterly Market Forecast for more than 18 years. It includes data on 12 major markets and 58 submarkets served by A/E/C firms. For more information, go to https://www.psmj.com/surveys/quarterly-market-forecast-2.
Related Stories
Market Data | Jun 21, 2017
Design billings maintain solid footing, strong momentum reflected in project inquiries/design contracts
Balanced growth results in billings gains in all sectors.

Market Data | Jun 16, 2017
Residential construction was strong, but not enough, in 2016
The Joint Center for Housing Studies’ latest report expects minorities and millennials to account for the lion’s share of household formations through 2035.

Industry Research | Jun 15, 2017
Commercial Construction Index indicates high revenue and employment expectations for 2017
USG Corporation (USG) and U.S. Chamber of Commerce release survey results gauging confidence among industry leaders.

Market Data | Jun 2, 2017
Nonresidential construction spending falls in 13 of 16 segments in April
Nonresidential construction spending fell 1.7% in April 2017, totaling $696.3 billion on a seasonally adjusted, annualized basis, according to analysis of U.S. Census Bureau data released today by Associated Builders and Contractors.

Industry Research | May 25, 2017
Project labor agreement mandates inflate cost of construction 13%
Ohio schools built under government-mandated project labor agreements (PLAs) cost 13.12 percent more than schools that were bid and constructed through fair and open competition.

Market Data | May 24, 2017
Design billings increasing entering height of construction season
All regions report positive business conditions.

Market Data | May 24, 2017
The top franchise companies in the construction pipeline
3 franchise companies comprise 65% of all rooms in the Total Pipeline.

Industry Research | May 24, 2017
These buildings paid the highest property taxes in 2016
Office buildings dominate the list, but a residential community climbed as high as number two on the list.

Market Data | May 16, 2017
Construction firms add 5,000 jobs in April
Unemployment down to 4.4%; Specialty trade jobs dip slightly.
Multifamily Housing | May 10, 2017
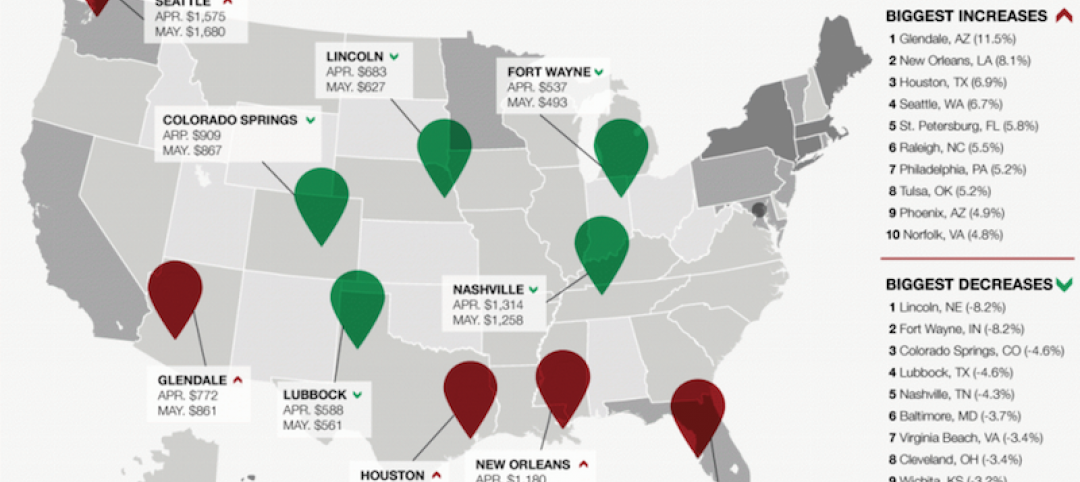
May 2017 National Apartment Report
Median one-bedroom rent rose to $1,012 in April, the highest it has been since January.


