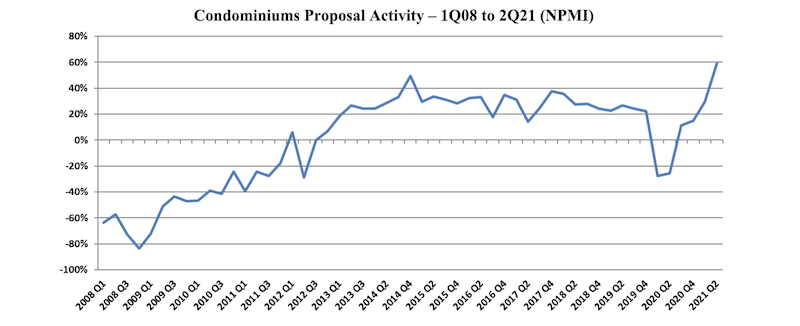
Proposal activity for Multifamily-for-Rent (Apartments) and Condominium properties continued to exceed historic norms, with Condos achieving its highest level since PSMJ Resources began tracking submarkets in its Quarterly Market Forecast (QMF) of A/E/C firm leaders. Apartments, which recorded its third-highest NPMI of 71% in the 1st Quarter, repeated that score in the 2nd Quarter.
While 61% of respondents working in the Condo market reported an increase in proposal activity from the 1st Quarter to the 2nd Quarter, only 2% saw a decline. This net plus/minus index (NPMI) of 59% exceeded the previous high for Condos of 49% achieved in the 4th Quarter of 2014.
Second-quarter proposal activity for Apartments continued to outpace all other submarkets in the Housing sector and all but one (Product Manufacturing) of the 58 submarkets measured across all construction sectors. A full three-quarters of the A/E/C firm leaders responding to PSMJ’s quarterly survey said that Multifamily proposal opportunities grew in the 2nd Quarter compared with only 4% who reported a decline.
The NPMI expresses the difference between the percentage of PSMJ member firms reporting an increase in proposal activity and those reporting a decrease. The QMF has proven to be a solid predictor of market health for 12 major markets served by the A/E/C industry since its inception in 2003, and for 58 submarkets since 2006.
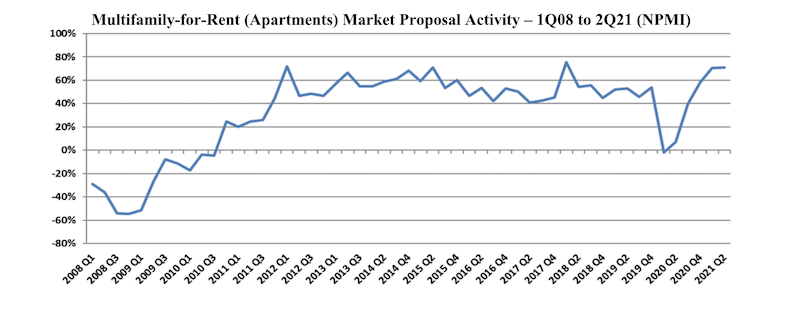
The record-high NPMI for Apartments was 76% in the 1st Quarter of 2018, followed by 72% in the 1st Quarter of 2012 and 71% in the 1st Quarters of 2015 and 2021.
PSMJ Senior Principal David Burstein, PE, AECPM, says the future strength of the housing market relies heavily on the ability of state and federal government agencies to invest adequately in infrastructure. “The condo and apartment markets have been on fire for several years, resulting in a lot of new multifamily housing,” says Burstein. “This is now creating traffic and other congestion problems which, if not dealt with by the cognizant government agencies, may cause the multifamily market to slow down in the coming quarters. So it is important to continue tracking the PSMJ NPMI over the next few quarters to spot any emerging slowdowns.”
The Assisted/Independent Senior Living submarket leveled off to an NPMI of 49%, down 10 NPMI percentage points from the 1st Quarter. While 51% of respondents reported an increase in proposal activity, only 2% saw a drop and the remaining 47% said opportunities were flat.
The two other Housing submarkets measured in the PSMJ survey remained strong. The Housing Subdivision market recorded an NPMI of 68% for a second straight month, as not a single respondent in the 2nd Quarter survey reported a decline in proposal opportunities. Single-Family Homes also repeated its 1st Quarter NPMI; the 51% index score once again tied for its second-highest level since the inception of submarket data tracking in the QMF.
PSMJ Resources, a consulting and publishing company dedicated to the A/E/C industry, has conducted its Quarterly Market Forecast for more than 18 years. It includes data on 12 major markets and 58 submarkets served by A/E/C firms. For more information, go to https://www.psmj.com/surveys/quarterly-market-forecast-2.
Related Stories
Market Data | Mar 29, 2017
Contractor confidence ends 2016 down but still in positive territory
Although all three diffusion indices in the survey fell by more than five points they remain well above the threshold of 50, which signals that construction activity will continue to be one of the few significant drivers of economic growth.
Market Data | Mar 24, 2017
These are the most and least innovative states for 2017
Connecticut, Virginia, and Maryland are all in the top 10 most innovative states, but none of them were able to claim the number one spot.
Market Data | Mar 22, 2017
After a strong year, construction industry anxious about Washington’s proposed policy shifts
Impacts on labor and materials costs at issue, according to latest JLL report.
Market Data | Mar 22, 2017
Architecture Billings Index rebounds into positive territory
Business conditions projected to solidify moving into the spring and summer.
Market Data | Mar 15, 2017
ABC's Construction Backlog Indicator fell to end 2016
Contractors in each segment surveyed all saw lower backlog during the fourth quarter, with firms in the heavy industrial segment experiencing the largest drop.
Market Data | Feb 28, 2017
Leopardo’s 2017 Construction Economics Report shows year-over-year construction spending increase of 4.2%
The pace of growth was slower than in 2015, however.
Market Data | Feb 23, 2017
Entering 2017, architecture billings slip modestly
Despite minor slowdown in overall billings, commercial/ industrial and institutional sectors post strongest gains in over 12 months.
Market Data | Feb 16, 2017
How does your hospital stack up? Grumman/Butkus Associates 2016 Hospital Benchmarking Survey
Report examines electricity, fossil fuel, water/sewer, and carbon footprint.
Market Data | Feb 1, 2017
Nonresidential spending falters slightly to end 2016
Nonresidential spending decreased from $713.1 billion in November to $708.2 billion in December.
Market Data | Jan 31, 2017
AIA foresees nonres building spending increasing, but at a slower pace than in 2016
Expects another double-digit growth year for office construction, but a more modest uptick for health-related building.


