Yardi® Matrix analyzed multifamily transaction activity for its final special report of 2020, and found that property sales are down sharply – though impact varies regionally - as a result of the pandemic.
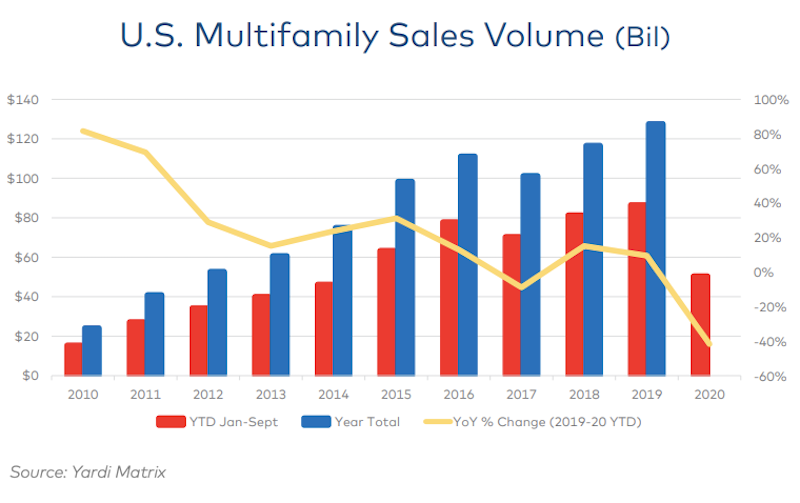
Through three quarters in 2020, $50.6 billion of multifamily property sales were completed in the U.S., down 41.7% from $86.5 billion through the same period a year ago, according to the report. There’s little hope full-year volume will get close to 2019’s record high of $127.8 billion. Gateway and coastal metros have generally seen a larger decline in deal flow than secondary and tertiary markets in the Sun Belt and Southwest.
“Much of the change could be described as a ‘filtering’ effect: investors moving from urban cores to inner-ring suburbs, from primary to secondary metros and from secondary to tertiary metros. This phenomenon results from several factors, including owners putting fewer properties on the market, disagreement between buyers and sellers about prices, the composition of buyers, and the competition for assets,” states the report.
Like many industries, multifamily sales saw a stronger performance in Q3 than during earlier in the year. Capital availability is relatively strong due to lack of better alternatives, optimism about future demand for housing, and the stability afforded by the government-sponsored enterprises Fannie Mae and Freddie Mac.
Gain all the insight in this special multifamily transaction report from industry data leader Yardi Matrix.
Yardi Matrix offers the industry’s most comprehensive market intelligence tool for investment professionals, equity investors, lenders and property managers who underwrite and manage investments in commercial real estate. Yardi Matrix covers multifamily, industrial, office and self storage property types. Email matrix@yardi.com, call 480-663-1149 or visit yardimatrix.com to learn more.
Related Stories
Senior Living Design | May 9, 2017
Designing for a future of limited mobility
There is an accessibility challenge facing the U.S. An estimated 1 in 5 people will be aged 65 or older by 2040.
Industry Research | May 4, 2017
How your AEC firm can go from the shortlist to winning new business
Here are four key lessons to help you close more business.
Engineers | May 3, 2017
At first buoyed by Trump election, U.S. engineers now less optimistic about markets, new survey shows
The first quarter 2017 (Q1/17) of ACEC’s Engineering Business Index (EBI) dipped slightly (0.5 points) to 66.0.
Market Data | May 2, 2017
Nonresidential Spending loses steam after strong start to year
Spending in the segment totaled $708.6 billion on a seasonally adjusted, annualized basis.
Market Data | May 1, 2017
Nonresidential Fixed Investment surges despite sluggish economic in first quarter
Real gross domestic product (GDP) expanded 0.7 percent on a seasonally adjusted annualized rate during the first three months of the year.
Industry Research | Apr 28, 2017
A/E Industry lacks planning, but still spending large on hiring
The average 200-person A/E Firm is spending $200,000 on hiring, and not budgeting at all.
Market Data | Apr 19, 2017
Architecture Billings Index continues to strengthen
Balanced growth results in billings gains in all regions.
Market Data | Apr 13, 2017
2016’s top 10 states for commercial development
Three new states creep into the top 10 while first and second place remain unchanged.
Market Data | Apr 6, 2017
Architecture marketing: 5 tools to measure success
We’ve identified five architecture marketing tools that will help your firm evaluate if it’s on the track to more leads, higher growth, and broader brand visibility.
Market Data | Apr 3, 2017
Public nonresidential construction spending rebounds; overall spending unchanged in February
The segment totaled $701.9 billion on a seasonally adjusted annualized rate for the month, marking the seventh consecutive month in which nonresidential spending sat above the $700 billion threshold.


