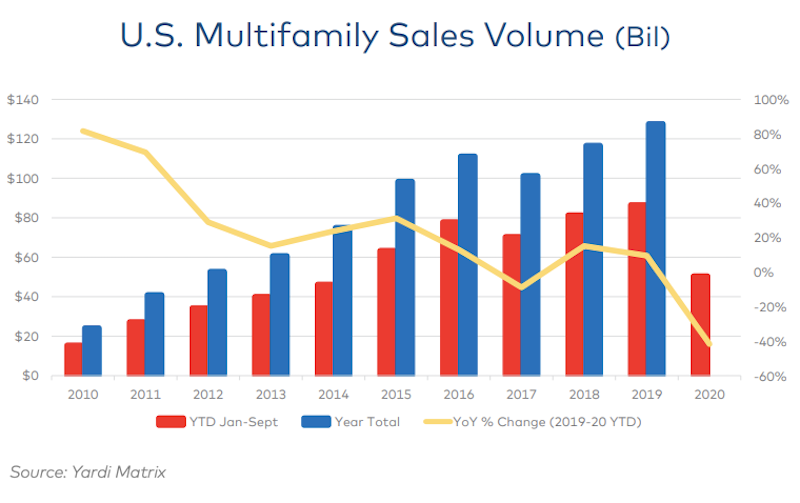
Yardi® Matrix analyzed multifamily transaction activity for its final special report of 2020, and found that property sales are down sharply – though impact varies regionally - as a result of the pandemic.
Through three quarters in 2020, $50.6 billion of multifamily property sales were completed in the U.S., down 41.7% from $86.5 billion through the same period a year ago, according to the report. There’s little hope full-year volume will get close to 2019’s record high of $127.8 billion. Gateway and coastal metros have generally seen a larger decline in deal flow than secondary and tertiary markets in the Sun Belt and Southwest.
“Much of the change could be described as a ‘filtering’ effect: investors moving from urban cores to inner-ring suburbs, from primary to secondary metros and from secondary to tertiary metros. This phenomenon results from several factors, including owners putting fewer properties on the market, disagreement between buyers and sellers about prices, the composition of buyers, and the competition for assets,” states the report.
Like many industries, multifamily sales saw a stronger performance in Q3 than during earlier in the year. Capital availability is relatively strong due to lack of better alternatives, optimism about future demand for housing, and the stability afforded by the government-sponsored enterprises Fannie Mae and Freddie Mac.
Gain all the insight in this special multifamily transaction report from industry data leader Yardi Matrix.
Yardi Matrix offers the industry’s most comprehensive market intelligence tool for investment professionals, equity investors, lenders and property managers who underwrite and manage investments in commercial real estate. Yardi Matrix covers multifamily, industrial, office and self storage property types. Email matrix@yardi.com, call 480-663-1149 or visit yardimatrix.com to learn more.
Related Stories
Market Data | Aug 2, 2017
Nonresidential Construction Spending falls in June, driven by public sector
June’s weak construction spending report can be largely attributed to the public sector.
Market Data | Jul 31, 2017
U.S. economic growth accelerates in second quarter; Nonresidential fixed investment maintains momentum
Nonresidential fixed investment, a category of GDP embodying nonresidential construction activity, expanded at a 5.2% seasonally adjusted annual rate.
Multifamily Housing | Jul 27, 2017
Apartment market index: Business conditions soften, but still solid
Despite some softness at the high end of the apartment market, demand for apartments will continue to be substantial for years to come, according to the National Multifamily Housing Council.
Market Data | Jul 25, 2017
What's your employer value proposition?
Hiring and retaining talent is one of the top challenges faced by most professional services firms.
Market Data | Jul 25, 2017
Moderating economic growth triggers construction forecast downgrade for 2017 and 2018
Prospects for the construction industry have weakened with developments over the first half of the year.
Industry Research | Jul 6, 2017
The four types of strategic real estate amenities
From swimming pools to pirate ships, amenities (even crazy ones) aren’t just perks, but assets to enhance performance.
Market Data | Jun 29, 2017
Silicon Valley, Long Island among the priciest places for office fitouts
Coming out on top as the most expensive market to build out an office is Silicon Valley, Calif., with an out-of-pocket cost of $199.22.
Market Data | Jun 26, 2017
Construction disputes were slightly less contentious last year
But poorly written and administered contracts are still problems, says latest Arcadis report.
Industry Research | Jun 26, 2017
Time to earn an architecture license continues to drop
This trend is driven by candidates completing the experience and examination programs concurrently and more quickly.
Industry Research | Jun 22, 2017
ABC's Construction Backlog Indicator rebounds in 2017
The first quarter showed gains in all categories.


