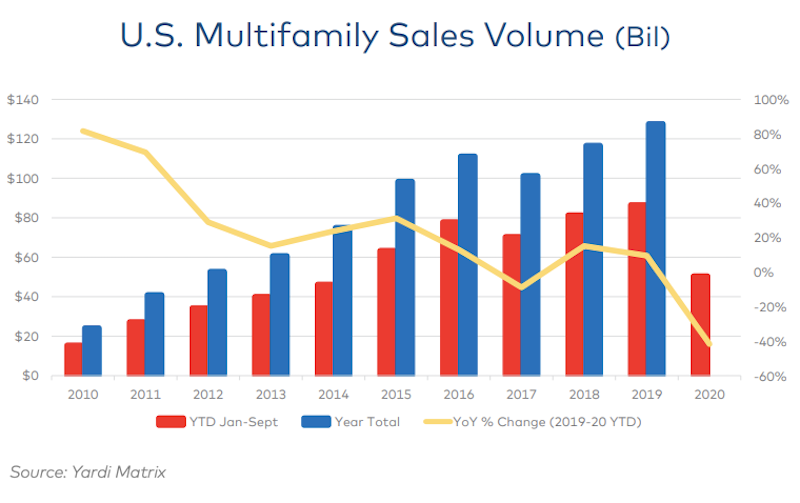
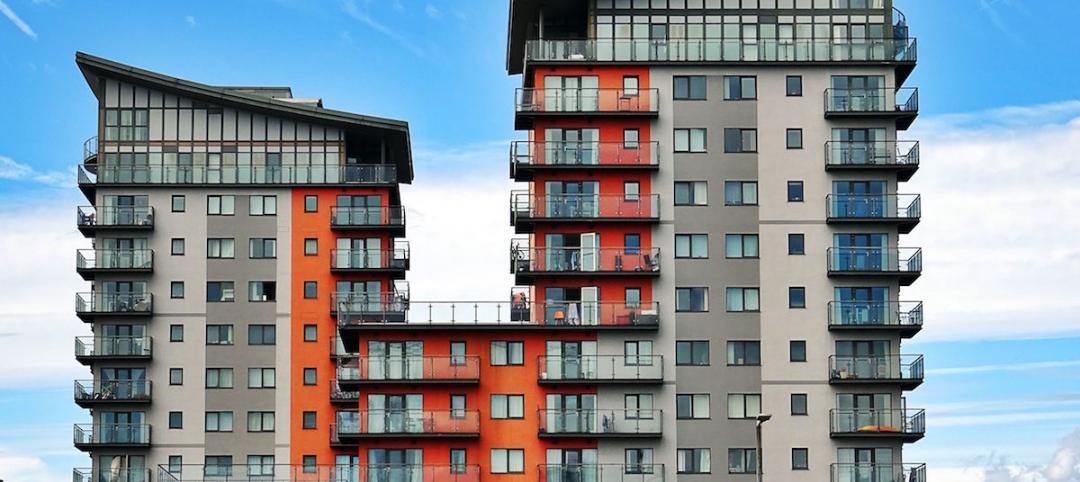
Yardi® Matrix analyzed multifamily transaction activity for its final special report of 2020, and found that property sales are down sharply – though impact varies regionally - as a result of the pandemic.
Through three quarters in 2020, $50.6 billion of multifamily property sales were completed in the U.S., down 41.7% from $86.5 billion through the same period a year ago, according to the report. There’s little hope full-year volume will get close to 2019’s record high of $127.8 billion. Gateway and coastal metros have generally seen a larger decline in deal flow than secondary and tertiary markets in the Sun Belt and Southwest.
“Much of the change could be described as a ‘filtering’ effect: investors moving from urban cores to inner-ring suburbs, from primary to secondary metros and from secondary to tertiary metros. This phenomenon results from several factors, including owners putting fewer properties on the market, disagreement between buyers and sellers about prices, the composition of buyers, and the competition for assets,” states the report.
Like many industries, multifamily sales saw a stronger performance in Q3 than during earlier in the year. Capital availability is relatively strong due to lack of better alternatives, optimism about future demand for housing, and the stability afforded by the government-sponsored enterprises Fannie Mae and Freddie Mac.
Gain all the insight in this special multifamily transaction report from industry data leader Yardi Matrix.
Yardi Matrix offers the industry’s most comprehensive market intelligence tool for investment professionals, equity investors, lenders and property managers who underwrite and manage investments in commercial real estate. Yardi Matrix covers multifamily, industrial, office and self storage property types. Email matrix@yardi.com, call 480-663-1149 or visit yardimatrix.com to learn more.
Related Stories
Contractors | Jan 4, 2018
Construction spending in a ‘mature’ period of incremental growth
Labor shortages are spiking wages. Materials costs are rising, too.
Market Data | Dec 20, 2017
Architecture billings upturn shows broad strength
The American Institute of Architects (AIA) reported the November ABI score was 55.0, up from a score of 51.7 in the previous month.
Market Data | Dec 14, 2017
ABC chief economist predicts stable 2018 construction economy
There are risks to the 2018 outlook as a number of potential cost increases could come into play.
Market Data | Dec 13, 2017
Top world regions and markets in the global hotel construction pipeline
The top world region by project count is North America.
Market Data | Dec 11, 2017
Global hotel construction pipeline is growing
The Total Pipeline stands at 12,427 Projects/2,084,940 Rooms.
Market Data | Dec 11, 2017
Construction backlog surges, sets record in third quarter
CBI is a leading economic indicator that reflects the amount of construction work under contract, but not yet completed.
Market Data | Dec 7, 2017
Buoyed by healthy economy, ABC Index finds contractors upbeat
Despite rising construction labor and materials costs, 55% of contractors expect their profit margins to expand in the first half of 2018.
Market Data | Dec 5, 2017
Top health systems engaged in $21 billion of U.S. construction projects
Largest active projects are by Sutter Health, New York Presbyterian, and Scripps Health.
Industry Research | Nov 28, 2017
2018 outlook: Economists point to slowdown, AEC professionals say ‘no way’
Multifamily housing and senior living developments head the list of the hottest sectors heading into 2018, according a survey of 356 AEC professionals.
Market Data | Nov 27, 2017
Construction's contribution to U.S. economy highest in seven years
Thirty-seven states benefited from the rise in construction activity in their state, while 13 states experienced a reduction in activity.


