Access to wireless Internet connection is practically a must these days. That’s why the iconic CCTV building in China even went through a year-long retrofit to improve Wi-Fi signals for building occupants.
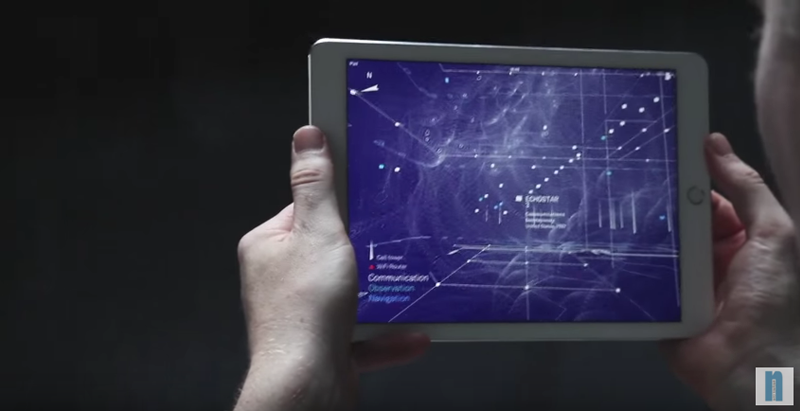
One application is stepping into the direction of Wi-Fi signal visualization. Called Architecture of Radio, the app has been described by Teche Blog as “one of the coolest apps [we've] come across in recent time.”
Users are able to see a 360-degree illustration of Wi-Fi signals around them based on data from seven million cell towers, 19 million Wi-Fi routers, and hundreds of satellites.
The application was created by software developer Richard Vijgen, and can plot not just wireless, but also wired network signals. The catch: signals are not shown in real time, but from a database. In other words, the app “gives you a pretty good idea of the density of digital signals around you, but it won’t tell you where to move the couch to get a better WiFi signal,” the app description says.
"The purpose of this app is to make the invisible visible so we can look at it, think about it, and discuss it," Vijgen told Teche Blog.
Released on the Apple App Store on Nov. 17, the application currently has 2.5 stars from 116 ratings.
“Definitely a cool concept with a relatively intuitive interface. The main problem is in all the unidentified cell towers,” writes reviewer Mistergizmo. “Since the app works off a database rather than real-time signals, this should be fixable, which I'm sure it will be, at which point I'll increase the number of stars. But in the meantime, it's certainly a fun app.”
Related Stories
AEC Tech | Apr 15, 2016
Should architects learn to code?
Even if learning to code does not personally interest you, the growing demand for having these capabilities in an architectural business cannot be overlooked, writes computational design expert Nathan Miller.
Building Tech | Apr 12, 2016
Should we be worried about a tech slowdown?
Is the U.S. in an innovative funk, or is this just the calm before the storm?
BIM and Information Technology | Apr 8, 2016
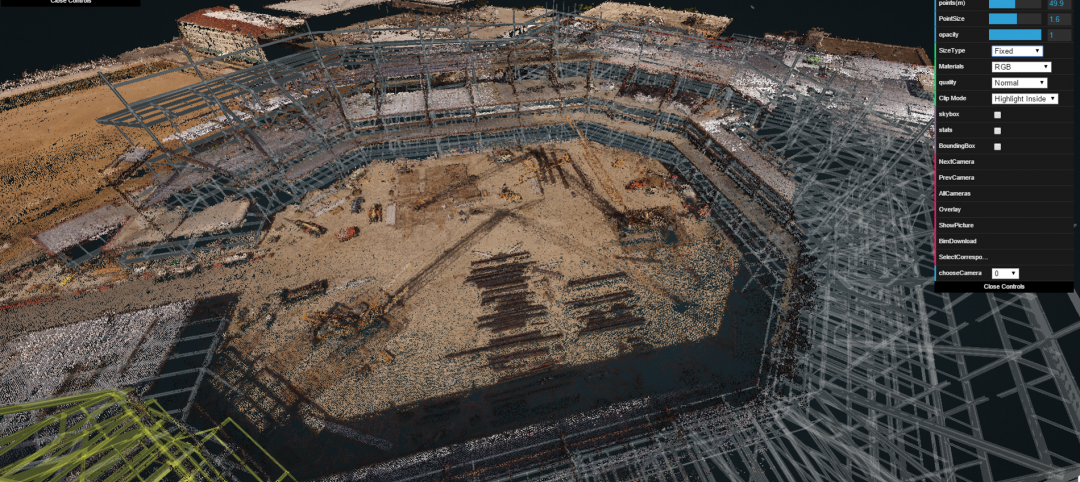
Turner streamlines construction progress tracking using predictive visual data analytics
The construction giant teams with a computer science and engineering professor to develop a clever drone- and rover-based construction monitoring tool.
BIM and Information Technology | Apr 5, 2016
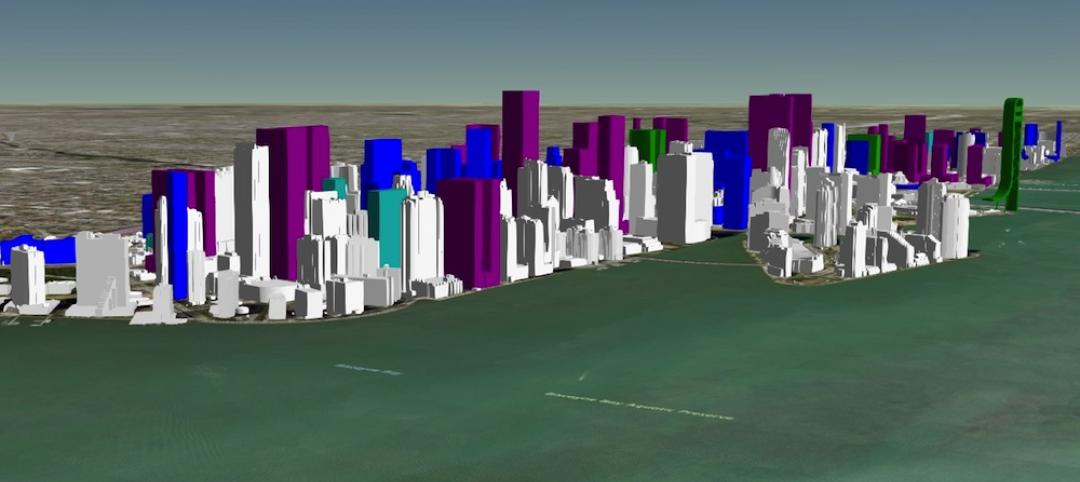
Interactive 3D map shows present and future Miami skyline
The Downtown Miami Interactive 3-D Skyline Map lets users see the status of every downtown office, retail, residential, and hotel project.
AEC Tech | Mar 31, 2016
Deep Learning + AI: How machines are becoming master problem solvers
Besides revolutionary changes to the world’s workforce, artificial intelligence could have a profound impact on the built environment and the AEC industry.
Big Data | Mar 28, 2016
Predictive analytics: How design firms can benefit from using data to find patterns, trends, and relationships
Branden Collingsworth, HDR’s new Director of Predictive Analytics, clarifies what his team does and how architecture projects can benefit from predictive analytics.
BIM and Information Technology | Mar 21, 2016
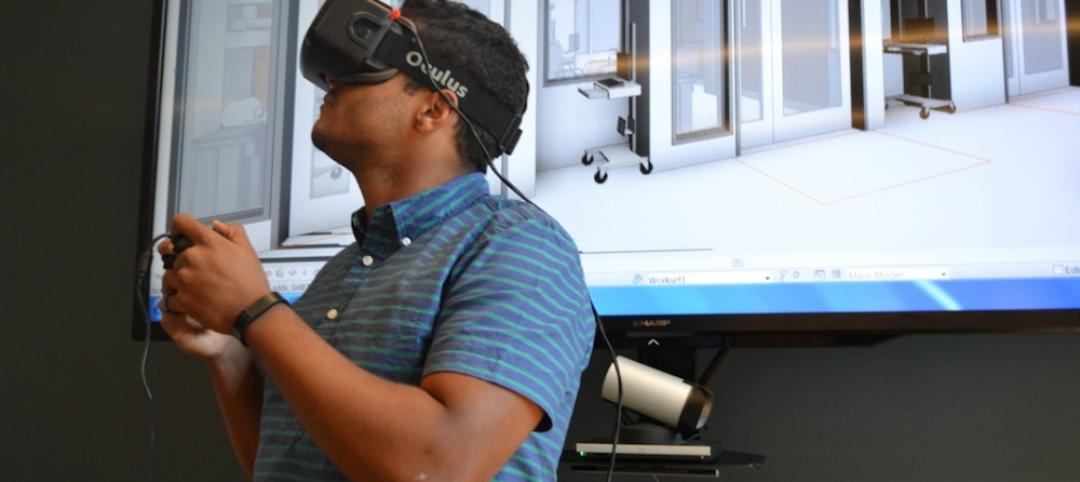
Latest tech devices simplify the leap from BIM to virtual reality
Faster conversion times and higher-quality graphics are enabling VR to make the jump from novelty to necessity in the AEC world.
AEC Tech | Mar 15, 2016
Two to tango: Project Tango isn’t just for entertainment, it also has a wide range of possibilities relating to the professional world
Making things like augmented reality, precise measurements of indoor spaces, and indoor wayfinding possible, Google’s Project Tango has all the makings to become a useful and ubiquitous tool in the AEC market.
BIM and Information Technology | Mar 14, 2016
Visual estimating, generative design, and component construction push the limits of BIM/VDC
DPR Construction, JE Dunn, and The Living advance the AEC industry with three clever tech solutions.
Drones | Mar 9, 2016
A new image-capturing platform mediates drone and cloud technologies
3DRobotics, Autodesk, and Sony launch Site Scan to speed the process of making models from field data.


