Access to wireless Internet connection is practically a must these days. That’s why the iconic CCTV building in China even went through a year-long retrofit to improve Wi-Fi signals for building occupants.
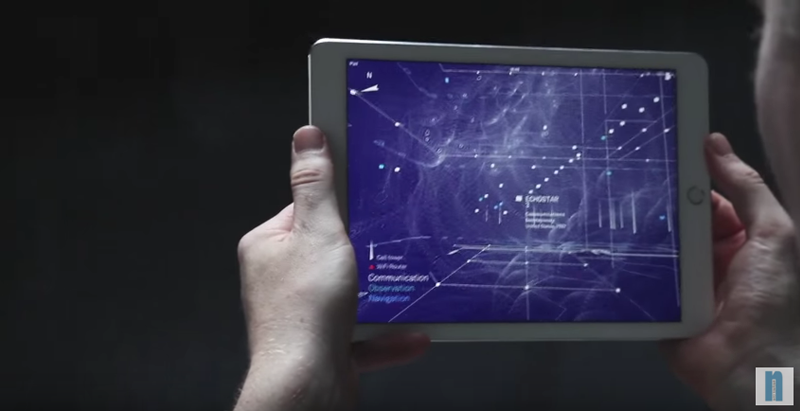
One application is stepping into the direction of Wi-Fi signal visualization. Called Architecture of Radio, the app has been described by Teche Blog as “one of the coolest apps [we've] come across in recent time.”
Users are able to see a 360-degree illustration of Wi-Fi signals around them based on data from seven million cell towers, 19 million Wi-Fi routers, and hundreds of satellites.
The application was created by software developer Richard Vijgen, and can plot not just wireless, but also wired network signals. The catch: signals are not shown in real time, but from a database. In other words, the app “gives you a pretty good idea of the density of digital signals around you, but it won’t tell you where to move the couch to get a better WiFi signal,” the app description says.
"The purpose of this app is to make the invisible visible so we can look at it, think about it, and discuss it," Vijgen told Teche Blog.
Released on the Apple App Store on Nov. 17, the application currently has 2.5 stars from 116 ratings.
“Definitely a cool concept with a relatively intuitive interface. The main problem is in all the unidentified cell towers,” writes reviewer Mistergizmo. “Since the app works off a database rather than real-time signals, this should be fixable, which I'm sure it will be, at which point I'll increase the number of stars. But in the meantime, it's certainly a fun app.”
Related Stories
| May 24, 2017
Accelerate Live! talk: Applying machine learning to building design, Daniel Davis, WeWork
Daniel Davis offers a glimpse into the world at WeWork, and how his team is rethinking workplace design with the help of machine learning tools.
| May 24, 2017
Accelerate Live! talk: Learning from Silicon Valley - Using SaaS to automate AEC, Sean Parham, Aditazz
Sean Parham shares how Aditazz is shaking up the traditional design and construction approaches by applying lessons from the tech world.
| May 24, 2017
Accelerate Live! talk: The data-driven future for AEC, Nathan Miller, Proving Ground
In this 15-minute talk at BD+C’s Accelerate Live! (May 11, 2017, Chicago), Nathan Miller presents his vision of a data-driven future for the business of design.
Big Data | May 24, 2017
Data literacy: Your data-driven advantage starts with your people
All too often, the narrative of what it takes to be ‘data-driven’ focuses on methods for collecting, synthesizing, and visualizing data.
AEC Tech | May 23, 2017
A funny thing may happen on the way to AI
As AI proves safe, big business will want to reduce overhead.
Building Technology | May 5, 2017
Tips for designing and building with bathroom pods
Advancements in building technology and ongoing concerns about labor shortages make prefabrication options such as bathrooms pods primed for an awakening.
BIM and Information Technology | Apr 24, 2017
Reconciling design energy models with real world results
Clark Nexsen’s Brian Turner explores the benefits and challenges of energy modeling and discusses how design firms can implement standards for the highest possible accuracy.
BIM and Information Technology | Apr 17, 2017
BIM: What do owners want?
Now more than ever, owners are becoming extremely focused on leveraging BIM to deliver their projects.
Sustainable Design and Construction | Apr 5, 2017
A new app brings precision to designing a building for higher performance
PlanIt Impact's sustainability scoring is based on myriad government and research data.
BIM and Information Technology | Mar 28, 2017
Digital tools accelerated the design and renovation of one contractor’s new office building
One shortcut: sending shop drawings created from laser scans directly to a wood panel fabricator.


