Nonresidential construction spending contracted 1.6% on a monthly basis in June, according to an Associated Builders and Contractors analysis of U.S. Census Bureau data released today. Spending totaled $742.4 billion on a seasonally adjusted annual rate for the month, a 4.2% increase from the same time one year ago. Private nonresidential spending fell 0.3% in June, while public nonresidential spending contracted by 3.5%.
“The hope is that June’s construction spending setback is merely a statistical aberration,” said ABC Chief Economist Anirban Basu. “That is certainly a possibility given the recent second quarter gross domestic product report, which among other things indicated extraordinarily rapid growth in the construction of structures. Other data, including ABC’s Construction Backlog Indicator, indicate ongoing elevated levels of demand for construction services. Construction employment statistics are also consistent with industry expansion.
“But as tempting as it is to simply relegate June spending data to the back burner, there are other less benign explanations,” said Basu. “One relates to worker productivity. With construction firms suffering grave difficulty finding skilled workers, it may simply be a case of slowed construction service delivery. However, this is not an especially compelling explanation for one month of data. The shortage of human capital is long-lived, and the recent pace of construction hiring has been rapid.
“A more likely explanation is that the recent surge in construction materials prices is resulting in material acquisition delays,” said Basu. “This has the effect of lengthening projects as contractors painstakingly search for the most affordable sources of steel, lumber or other inputs. Since monthly construction spending declines were apparent in both private and public segments, it is also possible that certain projects have been put on hold, with the hope that input prices will eventually decline to lower levels.” 
Related Stories
Market Data | Nov 22, 2021
Only 16 states and D.C. added construction jobs since the pandemic began
Texas, Wyoming have worst job losses since February 2020, while Utah, South Dakota add the most.
Market Data | Nov 10, 2021
Construction input prices see largest monthly increase since June
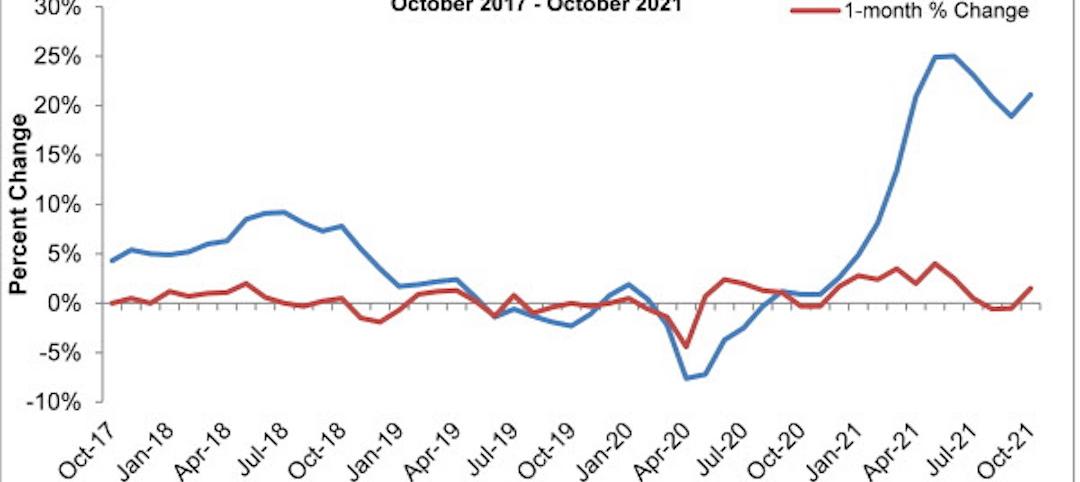
Construction input prices are 21.1% higher than in October 2020.
Market Data | Nov 9, 2021
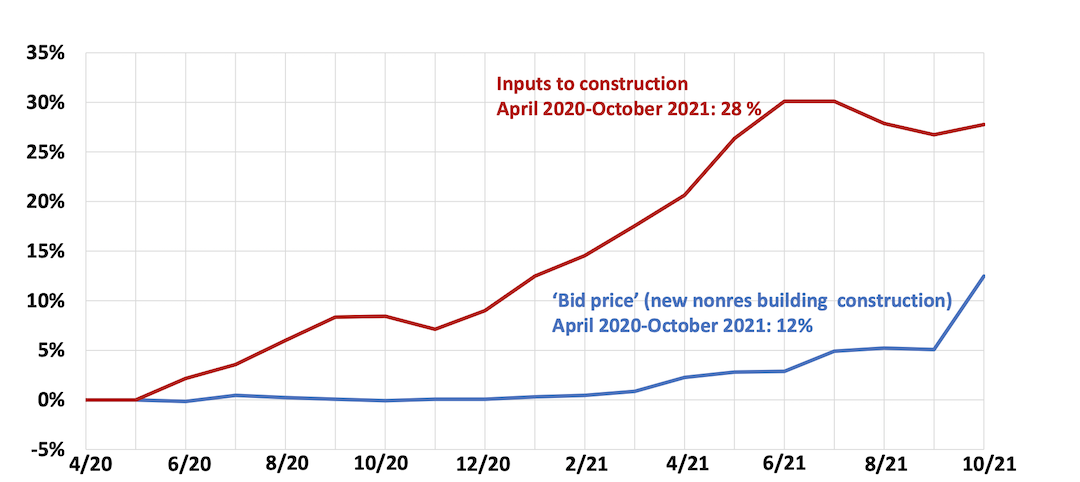
Continued increases in construction materials prices starting to drive up price of construction projects
Supply chain and labor woes continue.
Market Data | Nov 5, 2021
Construction firms add 44,000 jobs in October
Gain occurs even as firms struggle with supply chain challenges.
Market Data | Nov 3, 2021
One-fifth of metro areas lost construction jobs between September 2020 and 2021
Beaumont-Port Arthur, Texas and Sacramento--Roseville--Arden-Arcade Calif. top lists of gainers.
Market Data | Nov 2, 2021
Construction spending slumps in September
A drop in residential work projects adds to ongoing downturn in private and public nonresidential.
Hotel Facilities | Oct 28, 2021
Marriott leads with the largest U.S. hotel construction pipeline at Q3 2021 close
In the third quarter alone, Marriott opened 60 new hotels/7,882 rooms accounting for 30% of all new hotel rooms that opened in the U.S.
Hotel Facilities | Oct 28, 2021
At the end of Q3 2021, Dallas tops the U.S. hotel construction pipeline
The top 25 U.S. markets account for 33% of all pipeline projects and 37% of all rooms in the U.S. hotel construction pipeline.
Market Data | Oct 27, 2021
Only 14 states and D.C. added construction jobs since the pandemic began
Supply problems, lack of infrastructure bill undermine recovery.
Market Data | Oct 26, 2021
U.S. construction pipeline experiences highs and lows in the third quarter
Renovation and conversion pipeline activity remains steady at the end of Q3 ‘21, with conversion projects hitting a cyclical peak, and ending the quarter at 752 projects/79,024 rooms.


