Nonresidential construction spending contracted 1.6% on a monthly basis in June, according to an Associated Builders and Contractors analysis of U.S. Census Bureau data released today. Spending totaled $742.4 billion on a seasonally adjusted annual rate for the month, a 4.2% increase from the same time one year ago. Private nonresidential spending fell 0.3% in June, while public nonresidential spending contracted by 3.5%.
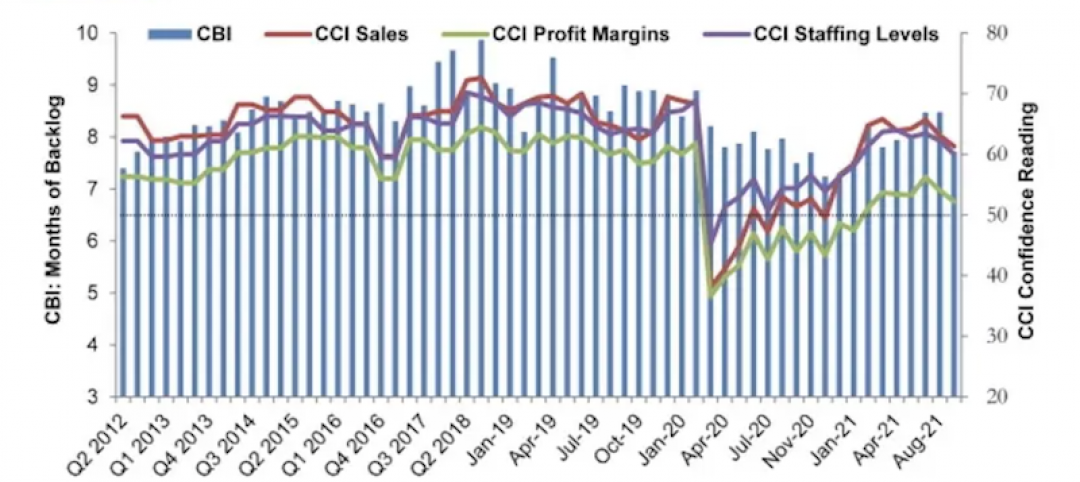
“The hope is that June’s construction spending setback is merely a statistical aberration,” said ABC Chief Economist Anirban Basu. “That is certainly a possibility given the recent second quarter gross domestic product report, which among other things indicated extraordinarily rapid growth in the construction of structures. Other data, including ABC’s Construction Backlog Indicator, indicate ongoing elevated levels of demand for construction services. Construction employment statistics are also consistent with industry expansion.
“But as tempting as it is to simply relegate June spending data to the back burner, there are other less benign explanations,” said Basu. “One relates to worker productivity. With construction firms suffering grave difficulty finding skilled workers, it may simply be a case of slowed construction service delivery. However, this is not an especially compelling explanation for one month of data. The shortage of human capital is long-lived, and the recent pace of construction hiring has been rapid.
“A more likely explanation is that the recent surge in construction materials prices is resulting in material acquisition delays,” said Basu. “This has the effect of lengthening projects as contractors painstakingly search for the most affordable sources of steel, lumber or other inputs. Since monthly construction spending declines were apparent in both private and public segments, it is also possible that certain projects have been put on hold, with the hope that input prices will eventually decline to lower levels.” 
Related Stories
Market Data | Sep 20, 2021
August construction employment lags pre-pandemic peak in 39 states
The coronavirus delta variant and supply problems hold back recovery.
Market Data | Sep 15, 2021
ABC’s Construction Backlog Indicator plummets in August; Contractor Confidence down
ABC’s Construction Confidence Index readings for sales, profit margins and staffing levels all fell modestly in August.
Market Data | Sep 7, 2021
Construction sheds 3,000 jobs in August
Gains are limited to homebuilding as other contractors struggle to fill both craft and salaried positions.
Market Data | Sep 3, 2021
Construction workforce shortages reach pre-pandemic levels
Coronavirus continues to impact projects and disrupt supply chains.
Multifamily Housing | Sep 1, 2021
Top 10 outdoor amenities at multifamily housing developments for 2021
Fire pits, lounge areas, and covered parking are the most common outdoor amenities at multifamily housing developments, according to new research from Multifamily Design+Construction.
Market Data | Sep 1, 2021
Construction spending posts small increase in July
Coronavirus, soaring costs, and supply disruptions threaten to erase further gains.
Market Data | Sep 1, 2021
Bradley Corp. survey finds office workers taking coronavirus precautions
Due to the rise in new strains of the virus, 70% of office workers have implemented a more rigorous handwashing regimen versus 59% of the general population.
Market Data | Aug 31, 2021
Three out of four metro areas add construction jobs from July 2020 to July 2021
COVID, rising costs, and supply chain woes may stall gains.
Market Data | Aug 24, 2021
July construction employment lags pre-pandemic peak in 36 states
Delta variant of coronavirus threatens to hold down further gains.
Market Data | Aug 17, 2021
Demand for design activity continues to expand
The ABI score for July was 54.6.


