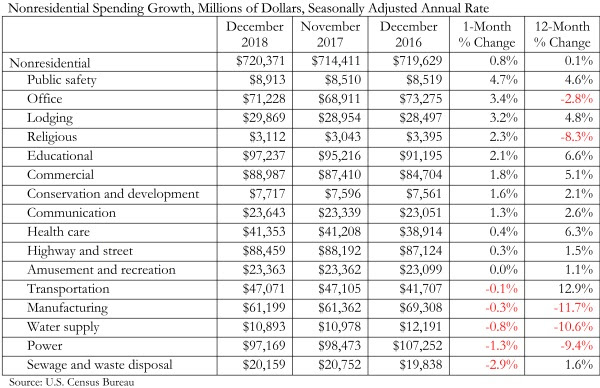
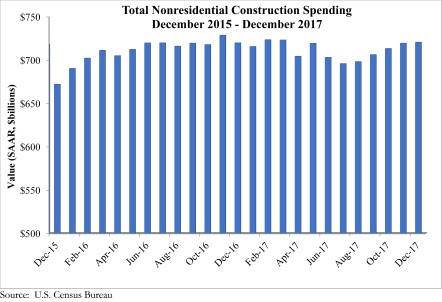
Nonresidential construction spending expanded 0.8% in December, totaling $720.4 billion on a seasonally adjusted basis, according to Associated Builders and Contractors’ (ABC) analysis of data released today by the U.S. Census Bureau. This represents the fifth consecutive month during which the pace of nonresidential spending has increased.
Nonresidential spending expanded 0.1% on a year-over-year basis and sits at its highest level since March. Private nonresidential construction spending increased 1.1% for the month, but is down 2.5% year over year, while public nonresidential spending increased 0.4% for the month and 4.4% for the year. Spending in the power and manufacturing categories, which are two of the largest nonresidential subsectors, contracted by a combined 10.3%, or $18.2 billion, since December 2016.
“While data releases are important for many reasons, including helping us to understand what happened in the past, their principal value lies in clarifying our shared understanding of the probable future,” said ABC Chief Economist Anirban Basu. “Today’s data release, which essentially confirms the existence of the ongoing construction expansion cycle, is less useful than usual. The obvious reason is that the December data reflect a pre-existing pattern of construction spending. The future is likely to represent a departure from prior trends, in large measure because of the recently passed tax reform bill.
“Even before the United States enacted tax reform, global and domestic financial systems were flush with liquidity and capital,” said Basu. “The tax cut will further bolster liquidity and confidence, which will ultimately translate into more construction starts and spending. If long-awaited progress is made on infrastructure spending, the construction recovery will likely transition from solid to spectacular. Note that the transportation category has already expanded 12.9% on a year-over-year basis. During much of the past three years, spending growth generally has been concentrated in a number of key private construction segments, while public construction has tended to lag.
“Of course, industry insiders are scratching their collective heads regarding how to amass enough human capital to actually deliver construction services on time and on budget,” said Basu. “Frankly, that’s a mystery. The implication is that any infrastructure package must be accompanied by action that helps expand apprenticeship programs, steps up investment in two-year colleges, encourages high schools to offer career and technical education, and encourages more people to leap into the U.S. labor force.”
Related Stories
Market Data | Oct 19, 2021
Demand for design services continues to increase
The Architecture Billings Index (ABI) score for September was 56.6.
Market Data | Oct 14, 2021
Climate-related risk could be a major headwind for real estate investment
A new trends report from PwC and ULI picks Nashville as the top metro for CRE prospects.
Market Data | Oct 14, 2021
Prices for construction materials continue to outstrip bid prices over 12 months
Construction officials renew push for immediate removal of tariffs on key construction materials.
Market Data | Oct 11, 2021
No decline in construction costs in sight
Construction cost gains are occurring at a time when nonresidential construction spending was down by 9.5 percent for the 12 months through July 2021.
Market Data | Oct 11, 2021
Nonresidential construction sector posts first job gain since March
Has yet to hit pre-pandemic levels amid supply chain disruptions and delays.
Market Data | Oct 4, 2021
Construction spending stalls between July and August
A decrease in nonresidential projects negates ongoing growth in residential work.
Market Data | Oct 1, 2021
Nonresidential construction spending dips in August
Spending declined on a monthly basis in 10 of the 16 nonresidential subcategories.
Market Data | Sep 29, 2021
One-third of metro areas lost construction jobs between August 2020 and 2021
Lawrence-Methuen Town-Salem, Mass. and San Diego-Carlsbad, Calif. top lists of metros with year-over-year employment increases.
Market Data | Sep 28, 2021
Design-Build projects should continue to take bigger shares of construction spending pie over next five years
FMI’s new study finds collaboration and creativity are major reasons why owners and AEC firms prefer this delivery method.
Market Data | Sep 22, 2021
Architecture billings continue to increase
The ABI score for August was 55.6, up from July’s score of 54.6.


