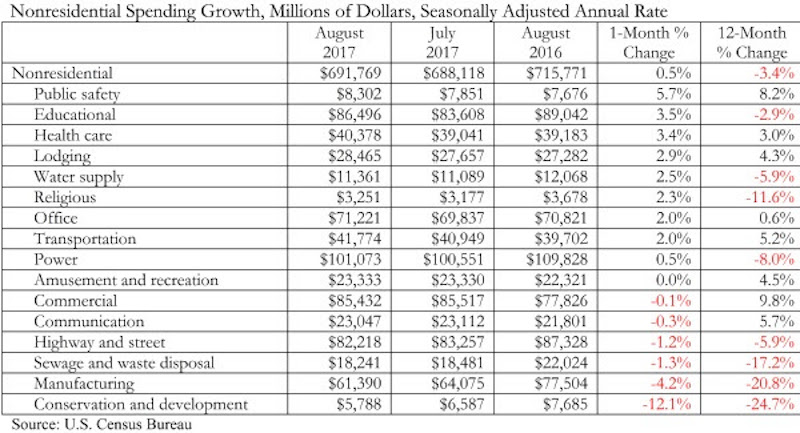
Nonresidential construction spending expanded 0.5% in August, totaling $691.8 billion on a seasonally adjusted, annualized basis, according to an analysis of data from the U.S. Census Bureau by Associated Builders and Contractors (ABC). Though this represents an improvement from July’s total ($688.2 billion), nonresidential spending remains 3.4 percent below its year-ago level and is down 3.8 percent from the cyclical peak attained in May 2017.
Spending levels expanded in 10 of the 16 nonresidential construction subsectors in August on a monthly basis. The manufacturing subsector experienced the largest absolute monthly decline (-$2.6 billion) and the greatest year-over-year decline (-$16.1 billion).
“Though nonresidential construction spending expanded in August, there is a disconnect between spending data and other data characterizing the level of activity, including backlog and employment,” said ABC Chief Economist Anirban Basu. “Collectively, nonresidential construction firms continue to hire, and staffing levels are well ahead of year-ago levels. That is consistent with a busier industry. ABC’s Construction Backlog Indicator (CBI) also continues to show that the average nonresidential construction firm can expect to remain busy, with a significant amount of future work already under contract. But the spending data show that the industry has actually become somewhat less busy over the past year.
“There are a number of possible explanations,” said Basu. “One is that employers may be forced in many instances to replace each retiring skilled worker with more than one employee. This is also consistent with declining industry productivity measured in terms of output per hour worked.
“Another possibility is that the construction segments that have been expanding in recent years are more labor intensive than those in which spending has been in decline,” said Basu. “Spending declines have been especially noteworthy in several capital-intensive public spending segments, including conservation and development and sewage and waste disposal. By contrast, spending increases over roughly the past three years have been apparent in segments requiring many workers specializing in high-quality finishes, including in the lodging and office categories.”

Related Stories
Market Data | Jul 31, 2017
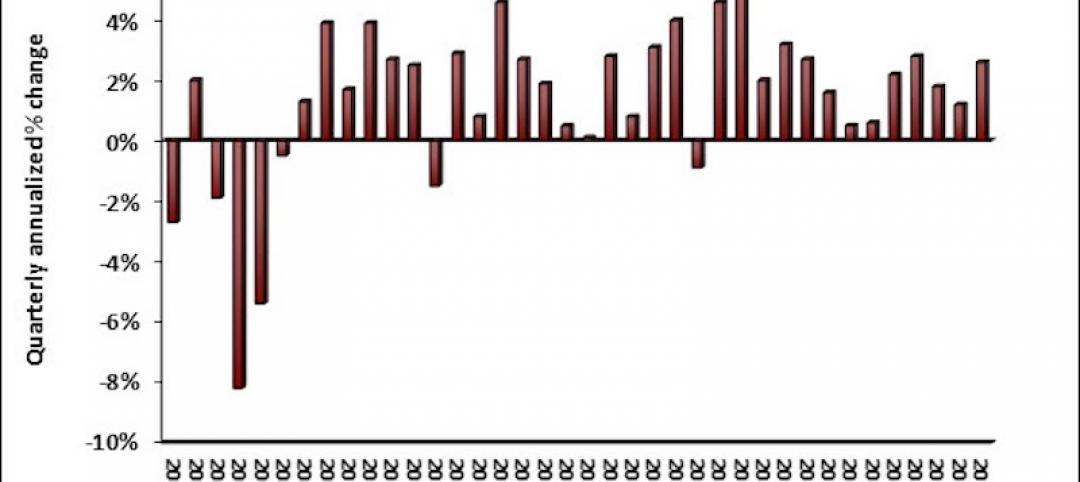
U.S. economic growth accelerates in second quarter; Nonresidential fixed investment maintains momentum
Nonresidential fixed investment, a category of GDP embodying nonresidential construction activity, expanded at a 5.2% seasonally adjusted annual rate.
Multifamily Housing | Jul 27, 2017
Game rooms and game simulators popular amenities in multifamily developments
The number of developments providing space for physical therapy was somewhat surprising, according to a new survey.
Architects | Jul 25, 2017
AIA 2030 Commitment expands beyond 400 architecture firms
The 2016 Progress Report is now available.
Market Data | Jul 25, 2017
Moderating economic growth triggers construction forecast downgrade for 2017 and 2018
Prospects for the construction industry have weakened with developments over the first half of the year.
Industry Research | Jul 6, 2017
The four types of strategic real estate amenities
From swimming pools to pirate ships, amenities (even crazy ones) aren’t just perks, but assets to enhance performance.
Market Data | Jun 29, 2017
Silicon Valley, Long Island among the priciest places for office fitouts
Coming out on top as the most expensive market to build out an office is Silicon Valley, Calif., with an out-of-pocket cost of $199.22.
Industry Research | Jun 27, 2017
What does the client really want?
In order to deliver superior outcomes to our healthcare clients, we have to know what our clients want.
Industry Research | Jun 26, 2017
Time to earn an architecture license continues to drop
This trend is driven by candidates completing the experience and examination programs concurrently and more quickly.
Industry Research | Jun 22, 2017
ABC's Construction Backlog Indicator rebounds in 2017
The first quarter showed gains in all categories.
Market Data | Jun 21, 2017
Design billings maintain solid footing, strong momentum reflected in project inquiries/design contracts
Balanced growth results in billings gains in all sectors.


