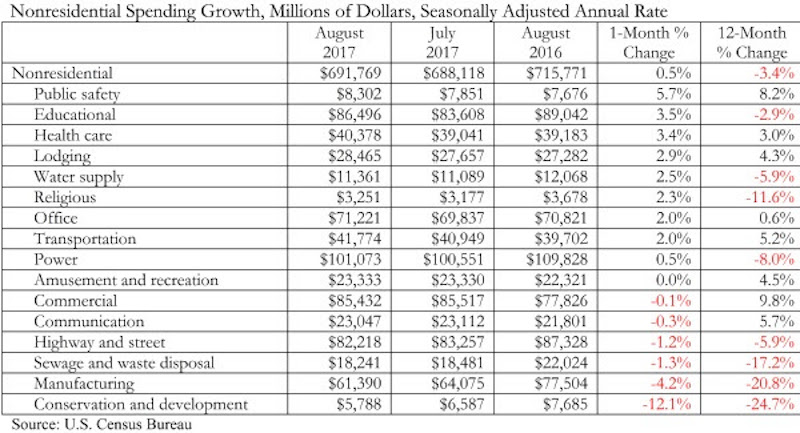
Nonresidential construction spending expanded 0.5% in August, totaling $691.8 billion on a seasonally adjusted, annualized basis, according to an analysis of data from the U.S. Census Bureau by Associated Builders and Contractors (ABC). Though this represents an improvement from July’s total ($688.2 billion), nonresidential spending remains 3.4 percent below its year-ago level and is down 3.8 percent from the cyclical peak attained in May 2017.
Spending levels expanded in 10 of the 16 nonresidential construction subsectors in August on a monthly basis. The manufacturing subsector experienced the largest absolute monthly decline (-$2.6 billion) and the greatest year-over-year decline (-$16.1 billion).
“Though nonresidential construction spending expanded in August, there is a disconnect between spending data and other data characterizing the level of activity, including backlog and employment,” said ABC Chief Economist Anirban Basu. “Collectively, nonresidential construction firms continue to hire, and staffing levels are well ahead of year-ago levels. That is consistent with a busier industry. ABC’s Construction Backlog Indicator (CBI) also continues to show that the average nonresidential construction firm can expect to remain busy, with a significant amount of future work already under contract. But the spending data show that the industry has actually become somewhat less busy over the past year.

“There are a number of possible explanations,” said Basu. “One is that employers may be forced in many instances to replace each retiring skilled worker with more than one employee. This is also consistent with declining industry productivity measured in terms of output per hour worked.
“Another possibility is that the construction segments that have been expanding in recent years are more labor intensive than those in which spending has been in decline,” said Basu. “Spending declines have been especially noteworthy in several capital-intensive public spending segments, including conservation and development and sewage and waste disposal. By contrast, spending increases over roughly the past three years have been apparent in segments requiring many workers specializing in high-quality finishes, including in the lodging and office categories.”

Related Stories
Industry Research | Jun 15, 2017
Commercial Construction Index indicates high revenue and employment expectations for 2017
USG Corporation (USG) and U.S. Chamber of Commerce release survey results gauging confidence among industry leaders.
Industry Research | Jun 13, 2017
Gender, racial, and ethnic diversity increases among emerging professionals
For the first time since NCARB began collecting demographics data, gender equity improved along every career stage.
Industry Research | May 25, 2017
Project labor agreement mandates inflate cost of construction 13%
Ohio schools built under government-mandated project labor agreements (PLAs) cost 13.12 percent more than schools that were bid and constructed through fair and open competition.
Market Data | May 24, 2017
Design billings increasing entering height of construction season
All regions report positive business conditions.
Market Data | May 24, 2017
The top franchise companies in the construction pipeline
3 franchise companies comprise 65% of all rooms in the Total Pipeline.
Industry Research | May 24, 2017
These buildings paid the highest property taxes in 2016
Office buildings dominate the list, but a residential community climbed as high as number two on the list.
Market Data | May 16, 2017
Construction firms add 5,000 jobs in April
Unemployment down to 4.4%; Specialty trade jobs dip slightly.
Industry Research | May 4, 2017
How your AEC firm can go from the shortlist to winning new business
Here are four key lessons to help you close more business.
Engineers | May 3, 2017
At first buoyed by Trump election, U.S. engineers now less optimistic about markets, new survey shows
The first quarter 2017 (Q1/17) of ACEC’s Engineering Business Index (EBI) dipped slightly (0.5 points) to 66.0.
Market Data | May 2, 2017
Nonresidential Spending loses steam after strong start to year
Spending in the segment totaled $708.6 billion on a seasonally adjusted, annualized basis.


