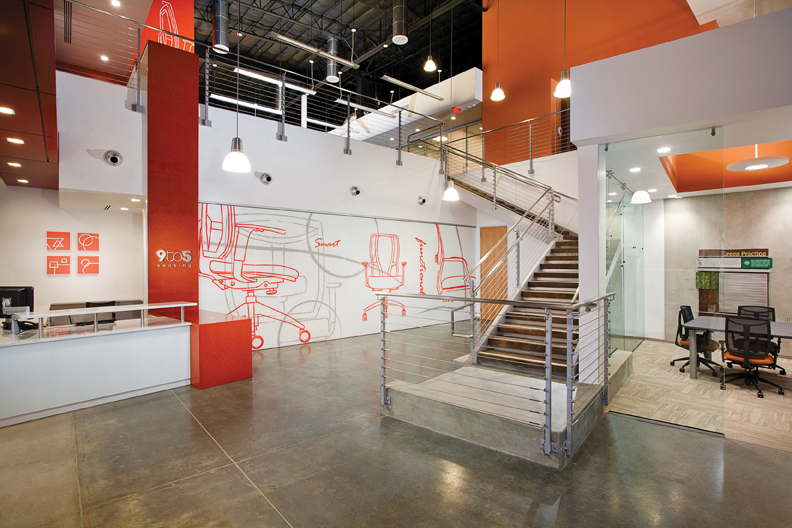
Is there life after death? Judging by the commercial office sector, maybe there is. After several years in an advanced stage of morbidity, propped up largely by tenant fitouts and renovations, the office sector may be starting to show signs of life.
The ULI Center for Capital Markets and Real Estate recently stated (based on data from CBRE) that the sector is expected to show “steady and substantial three-year improvements,” with vacancy rates declining from 15.4% this year, to 14.4% in 2013 and 12.3% by year-end 2014.
Rental rates should be up 3.7% in ’13, says the ULI. +
TOP 25 OFFICE SECTOR ARCHITECTURE FIRMS
| Rank | Company | 2011 Office Revenue ($) |
| 1 | Gensler | 432,000,000 |
| 2 | HOK | 144,865,720 |
| 3 | Perkins+Will | 103,737,646 |
| 4 | HDR Architecture | 40,800,000 |
| 5 | Kohn Pedersen Fox Associates | 40,030,000 |
| 6 | Hammel, Green and Abrahamson | 39,600,000 |
| 7 | NBBJ | 38,830,000 |
| 8 | RTKL Associates | 38,055,565 |
| 9 | Nelson | 36,223,716 |
| 10 | SmithGroupJJR | 30,700,000 |
| 11 | Heery International | 29,004,000 |
| 12 | PageSoutherlandPage | 28,130,000 |
| 13 | HLW International | 26,750,000 |
| 14 | HNTB Architecture | 25,231,479 |
| 15 | Cannon Design | 23,000,000 |
| 16 | IBI Group | 22,391,853 |
| 17 | EYP Architecture & Engineering | 20,000,000 |
| 18 | Little | 19,739,500 |
| 19 | LEO A DALY | 16,832,770 |
| 20 | Ware Malcomb | 16,762,000 |
| 21 | DLR Group | 14,000,000 |
| 22 | ZGF Architects | 13,227,504 |
| 23 | RSP Architects | 13,151,000 |
| 24 | HKS | 12,227,874 |
| 25 | Corgan Associates | 12,109,000 |
TOP 25 OFFICE SECTOR ENGINEERING FIRMS
| Rank | Company | 2011 Office Revenue ($) |
| 1 | AECOM Technology Corp. | 1,291,000,000 |
| 2 | Jacobs | 261,100,000 |
| 3 | Parsons Brinckerhoff | 127,900,000 |
| 4 | Science Applications International Corp. | 116,240,000 |
| 5 | URS Corp. | 58,000,000 |
| 6 | Burns & McDonnell | 43,493,660 |
| 7 | Michael Baker Jr., Inc. | 42,890,000 |
| 8 | Stantec | 42,300,000 |
| 9 | Dewberry | 41,215,530 |
| 10 | Thornton Tomasetti | 34,780,000 |
| 11 | WSP USA | 34,500,000 |
| 12 | ESD/Environmental Systems Design | 22,900,000 |
| 13 | Arup | 19,146,849 |
| 14 | Syska Hennessy Group | 18,504,074 |
| 15 | AKF Group | 15,500,000 |
| 16 | Sebesta Blomberg | 14,590,000 |
| 17 | GHT Limited | 13,891,000 |
| 18 | Clark Nexsen | 13,029,482 |
| 19 | Glumac | 11,736,618 |
| 20 | KPFF Consulting Engineers | 10,000,000 |
| 21 | R.G. Vanderweil Engineers | 9,354,500 |
| 22 | Wiss, Janney, Elstner Associates | 8,967,000 |
| 23 | RDK Engineers | 8,835,000 |
| 24 | H&A Architects & Engineers | 7,757,000 |
| 25 | Interface Engineering | 7,290,488 |
TOP 25 OFFICE SECTOR CONSTRUCTION FIRMS
| Rank | Company | 2011 Office Revenue ($) |
| 1 | Turner Corporation, The | 1,489,944,482 |
| 2 | Clark Group | 1,148,992,603 |
| 3 | Structure Tone | 1,004,320,000 |
| 4 | Balfour Beatty US | 825,948,471 |
| 5 | Hensel Phelps Construction | 619,660,000 |
| 6 | Gilbane Building Co. | 617,058,000 |
| 7 | PCL Construction Enterprises | 594,444,509 |
| 8 | BL Harbert International | 589,000,000 |
| 9 | James G. Davis Construction Corp. | 450,000,000 |
| 10 | Clayco | 426,000,000 |
| 11 | Suffolk Construction | 388,644,645 |
| 12 | Whiting-Turner Contracting Co., The | 386,520,693 |
| 13 | Holder Construction | 327,000,000 |
| 14 | Tutor Perini Corp. | 312,940,000 |
| 15 | Weitz Company, The | 302,418,397 |
| 16 | Ryan Companies US | 288,463,756 |
| 17 | DPR Construction | 261,922,722 |
| 18 | Jacobs | 261,100,000 |
| 19 | Webcor Builders | 229,121,806 |
| 20 | Mortenson | 221,980,000 |
| 21 | Walsh Group, The | 211,738,006 |
| 22 | JE Dunn Construction | 203,050,158 |
| 23 | Pepper Construction Group | 197,357,000 |
| 24 | Jones Lang LaSalle | 180,000,000 |
| 25 | Lend Lease | 173,228,092 |
Related Stories
| Aug 19, 2011
Enhanced acoustical design
Ambient noise levels in some facility types are trending up and becoming a barrier to clear communication between building occupants.
| Jul 22, 2011
The Right Platform for IPD
Workstations for successful integrated project delivery, a white paper by Dell and BD+C.
| Jul 22, 2011
High-performance windows and doors
Learning objectives After reading this article, you should be able to: Understand issues of thermal performance and energy efficiency in relation to window and door systems; describe optimal detailing of the window-wall interface and how it contributes to building performance, sustainability, and occupant well-being; understand how durability contributes to sustainable windows/doors; and list sustainable O&M requirements for window and door systems.
| Jul 21, 2011
Falling Architecture Billings Index reflects decrease in design demands
This months Architecture Billings Index (ABI), provided by the American Institute of Architects, is almost a full point lower than last month’s reported score. June’s reading of 47.2 was short of the required 50 to achieve billings increases, making July’s reading of 46.3 an unwelcome sign of market tidings.
| Jun 29, 2011
New leadership role for architects in net-zero design
BD+C Editorial Director Rob Cassidy talks with RNL Design's Tom Hootman, AIA, about the changing role of architects in net-zero designs.


