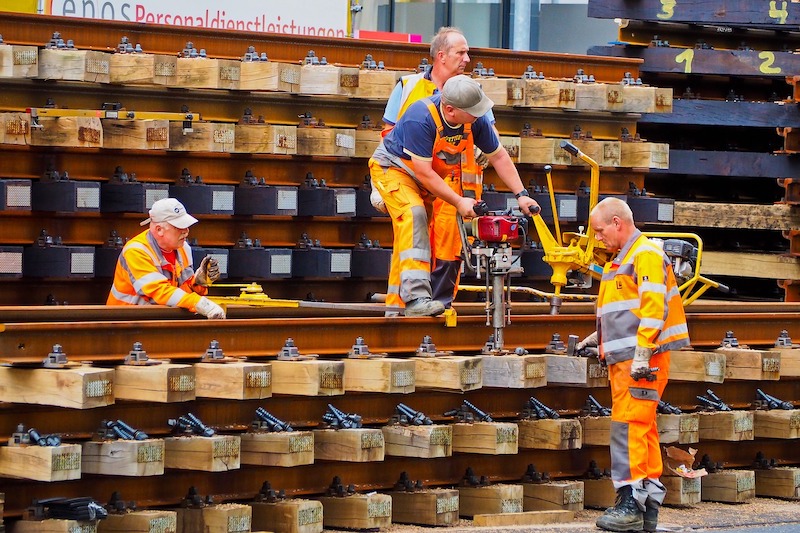
Steep monthly declines in public and private nonresidential construction spending offset a surge in homebuilding in July, while industry employment decreased compared to July 2019 levels in two-thirds of the nation’s metro areas, according to an analysis by the Associated General Contractors of America of government data released today. Association officials said many commercial construction firms were likely to continue shedding jobs without needed federal coronavirus relief measures.
“The dichotomy between slumping nonresidential projects—both public and private—and robust homebuilding seems sure to widen as the pandemic continues to devastate state and local finances and much of the private sector,” said Ken Simonson, the association’s chief economist. “Without new federal investments in infrastructure and other measures to boost demand for nonresidential construction, contractors will be forced to let more workers go.”
Construction spending in July totaled $1.36 trillion at a seasonally adjusted annual rate, a gain of 0.1% from June. A 1.2% drop in nonresidential spending nearly canceled out a 2.1% jump in residential spending, which was boosted by growth in both single-family (3.1%) and multifamily construction (4.9%).
Public construction spending decreased by 1.3%, dragged down by a 3.1% drop in highway and street construction spending and a 3.0% decline in educational construction spending, the two largest public segments. The next-largest segment, transportation facilities, also contracted, by 1.6 percent.
Private nonresidential construction spending slid 1.0% from June to July. The largest segment, power construction, dipped 0.1%. Among other large private spending categories, commercial construction—comprising retail, warehouse and farm structures—slumped 3.2%, while manufacturing construction rose 0.2% and office construction fell 0.7%.
Construction employment declined from July 2019 to July 2020 in 238, or 66%, out of 358 metro areas, increased in 90 areas (25%) and held steady in 30. New York City lost the most construction jobs (-26,500, -16%), while the steepest percentage loss occurred in Brockton-Bridgewater-Easton, Mass. (-36%, -2,100 jobs). Baltimore-Columbia-Towson, Md. added the most construction jobs over the year (4,800, 6%), while Walla Walla, Wash. had the largest percentage gain (25%, 300 jobs).
Association officials said that in addition to the new spending and metro employment data, the association is releasing the results of its annual workforce survey tomorrow that will underscore the need for new federal recovery measures. The construction officials called on Congress and the Trump administration to enact new infrastructure investments, pass a one-year extension to the current surface transportation law with additional transportation construction funding and enact liability reforms to shied firms that are protecting workers from the coronavirus from needless lawsuits.
“Without new federal relief measures, the industry’s limited recovery will likely be short lived,” said Stephen E. Sandherr, the association’s chief executive officer. “Congress and the President should be taking advantage of current market conditions to rebuild our infrastructure, restore lost jobs and reinvigorate the economy.”
View the metro employment data, rankings, highs and lows, and top 10.
Related Stories
Market Data | Aug 2, 2017
Nonresidential Construction Spending falls in June, driven by public sector
June’s weak construction spending report can be largely attributed to the public sector.
Market Data | Jul 31, 2017
U.S. economic growth accelerates in second quarter; Nonresidential fixed investment maintains momentum
Nonresidential fixed investment, a category of GDP embodying nonresidential construction activity, expanded at a 5.2% seasonally adjusted annual rate.
Multifamily Housing | Jul 27, 2017
Apartment market index: Business conditions soften, but still solid
Despite some softness at the high end of the apartment market, demand for apartments will continue to be substantial for years to come, according to the National Multifamily Housing Council.
Market Data | Jul 25, 2017
What's your employer value proposition?
Hiring and retaining talent is one of the top challenges faced by most professional services firms.
Market Data | Jul 25, 2017
Moderating economic growth triggers construction forecast downgrade for 2017 and 2018
Prospects for the construction industry have weakened with developments over the first half of the year.
Industry Research | Jul 6, 2017
The four types of strategic real estate amenities
From swimming pools to pirate ships, amenities (even crazy ones) aren’t just perks, but assets to enhance performance.
Market Data | Jun 29, 2017
Silicon Valley, Long Island among the priciest places for office fitouts
Coming out on top as the most expensive market to build out an office is Silicon Valley, Calif., with an out-of-pocket cost of $199.22.
Market Data | Jun 26, 2017
Construction disputes were slightly less contentious last year
But poorly written and administered contracts are still problems, says latest Arcadis report.
Industry Research | Jun 26, 2017
Time to earn an architecture license continues to drop
This trend is driven by candidates completing the experience and examination programs concurrently and more quickly.
Industry Research | Jun 22, 2017
ABC's Construction Backlog Indicator rebounds in 2017
The first quarter showed gains in all categories.


