While remote working is here to stay for many business professionals, there is going to come a time in the not too distant future when the pandemic ends and companies begin welcoming people back to the office. What will these returns look like? How will workspaces differ from pre-pandemic offices? Will work travel come back in full force? When people do come into the office, what are we gathering for, and what do we need?
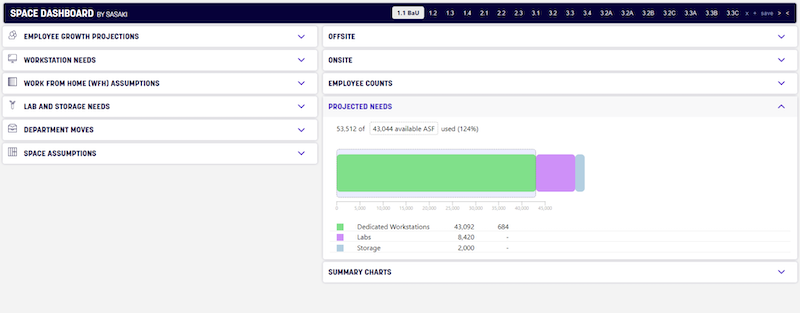
To help companies answer these fundamental questions and determine the best plan for a return to the office, Sasaki’s in-house data visualization specialists and software designers have created a new customizable space visualization tool dubbed the Space Dashboard.
The dashboard can measure inputs like work from home assumptions or lab and storage needs in order to provide insight into the complex factors impacting spatial needs for a given company.
Sasaki used the tool to help a Boston-based consumer products company analyze its office space. After the pandemic started, the company shifted to working remotely and, realizing it had outgrown its current office in terms of headcount and lab and storage space, wanted to better understand the available options for a new space once it was safe to return.

The company wanted to find the answers to how much additional real estate it would need to lease, what departments would need to relocate in order to continue working the same as pre-pandemic, how it would need to change its current work model, and how much room for growth it had moving forward if it wanted to stay in the current office space.
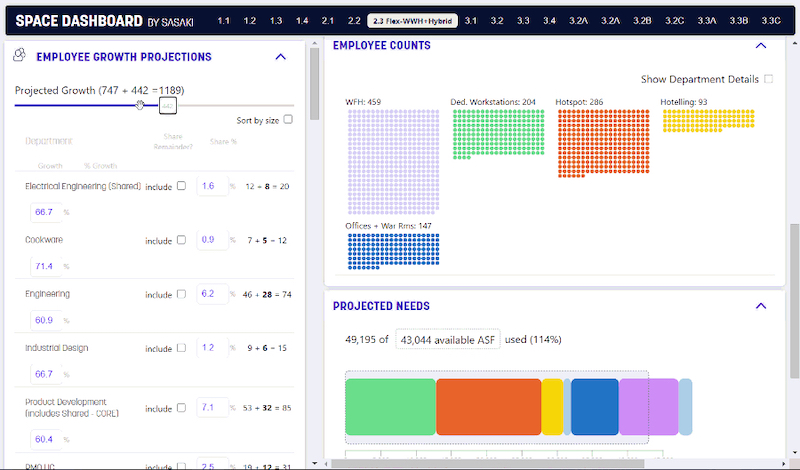
Sasaki plugged different factors into the Space Dashboard, such as allowing work from home policies, applying seat sharing ratios, and changing workstation styles, to create different scenarios and represent potential solutions for the company. The company could test alternatives or variations of the solutions by adjusting any of the inputs.
The tool made it easy for the company to make global assumptions like headcount growth projections, while also allowing it to make more granular decisions on things like workstation styles, work from home policies, and new program needs by individual departments. And because the model is readily adjustable, any future changes can be easily made to produce a new solution.
This one case study is not an isolated example.
“We’re seeing this exponential spike in demand from clients who need to map out future state scenarios responsive to COVID,” said Tristan Rock, Director of Business Development, Sasaki. “Despite the uncertainty, companies need to find ways to plan for the next three to six months and beyond.”


