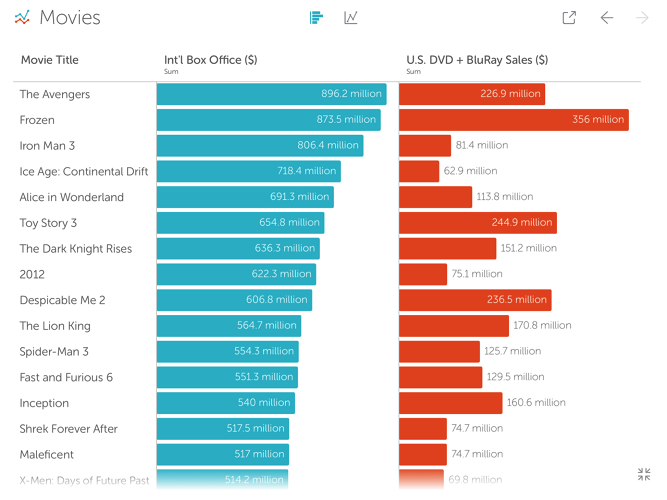
For those who can internalize colorful charts and graphs more effectively than spreadsheets filled with numbers, Vizable is an appropriate solution.
The new iPad app, from Tableau, converts CVS and Excel files into line or bar graphs in seconds, as Fast Company reports. From there, users choose what categories to view, and then swipe and pinch the screen to add columns, change fields, filter, and sort. Results can be shared via email and social media.
Seattle-based Tableau makes similar software for major businesses, but Vizable is meant for everyday users. For example, individuals can use the app to track their purchases, teachers can visualize their students’ test scores, and small businesses can analyze their expenses.
"We want to reach a group of people who don't think they can see and understand this type of data," said Dave Story, Tableau's vice president for mobile growth, in the Fast Company piece. "If someone's kid walks into a room and the app was open, we'd want them to think it's a fun game.
The app, which has been in production for two years, is available on iTunes for free.
Related Stories
| May 29, 2014
Turn your pen-and-paper sketches into digital drawings in seconds with this nifty gadget [video]
Funded through Kickstarter, iSketchnote uses a smart pen to instantly digitize hand-written notes and drawings.
| May 28, 2014
Video Blog: How today’s construction firms are bridging the BIM gap
Turner Construction and Parsons Brinckerhoff talk about how BIM has revolutionized the way that they conduct projects, and how technology has allowed them to leverage collaboration in such a way that they can work with decentralized teams.
| May 22, 2014
BIM-driven prototype turns data centers into a kit of parts
Data center design specialist SPARCH creates a modular scheme for solutions provider Digital Realty.
| May 22, 2014
Facebook, Telus push the limits of energy efficiency with new data centers
Building Teams are employing a range of creative solutions—from evaporative cooling to novel hot/cold-aisle configurations to heat recovery schemes—in an effort to slash energy and water demand.
| May 22, 2014
7 ways it pays to use BIM for data centers
Here’s where AEC firms and owners are getting the most bang for the buck when using BIM/VDC to coordinate data center projects.
| May 22, 2014
Big Data meets data centers – What the coming DCIM boom means to owners and Building Teams
The demand for sophisticated facility monitoring solutions has spurred a new market segment—data center infrastructure management (DCIM)—that is likely to impact the way data center projects are planned, designed, built, and operated.
| May 14, 2014
Prefab payback: Mortenson quantifies cost and schedule savings from prefabrication techniques
Value-based cost-benefit analysis of prefab approaches on the firm's 360-bed Exempla Saint Joseph Heritage Project shows significant savings for the Building Team.
| May 12, 2014
Defining BIM – What do owners really want?
Given the complexities of the building process, it can be difficult for building owners to effectively communicate what they want and need with BIM. The response to the question usually is, “Give me everything.”
| May 8, 2014
Perfecting prefab: 8 tips for healthcare construction projects
Leading AEC firms offer helpful advice for using BIM to pull off prefab for everything from MEP infrastructure to whole bathrooms.
| May 6, 2014
BIM Forum Boston recap: Gilbane inspires with collaboration challenge
Key question from BIM Forum: How do you leverage technology by finding trade partners that are up to speed?


