The Architecture Billings Index (ABI), produced by the AIA Economics & Market Research Group, is a leading economic indicator that provides an approximately nine- to twelve-month glimpse into the future of nonresidential construction spending activity. The diffusion indexes contained in the full report are derived from a monthly “work-on-the-boards” survey that is sent to a panel of AIA member-owned firms.
Participants are asked whether their billings increased, decreased, or stayed the same in the month that just ended as compared to the prior month, and the results are then compiled into the ABI. These monthly results are also seasonally adjusted to allow for comparison to prior months. The monthly ABI index scores are centered around 50, with scores above 50 indicating an aggregate increase in billings, and scores below 50 indicating a decline.
Following a generally positive performance in 2015, the Architecture Billings Index has begun this year modestly dipping back into negative terrain. The AIA reported the January ABI score was 49.6, down slightly from the mark of 51.3 in the previous month. This score reflects a minor decrease in design services (any score above 50 indicates an increase in billings). The new projects inquiry index was 55.3, down from a reading of 60.5 the previous month.
“The fundamentals are mostly sound in the nonresidential design and construction market,” said AIA Chief Economist, Kermit Baker, Hon. AIA, PhD. “January was a rocky month throughout the economy, with falling oil prices, international economic concerns, and with steep declines in stock market valuations in the U.S. and elsewhere. Some of the fallout of this uncertainty may have affected progress on design projects.”
Key January* ABI highlights:
- Regional averages: West (50.8), Northeast (50.4), South (50.3), Midwest (48.9),
- Sector index breakdown: multifamily residential (51.9), commercial / industrial (50.5), institutional (49.9), mixed practice (49.0)
- Project inquiries index: 55.3
- Design contracts index: 50.9
The regional and sector categories are calculated as a 3-month moving average, whereas the national index, design contracts and inquiries are monthly numbers.
* Every January the AIA research department updates the seasonal factors used to calculate the ABI, resulting in a revision of recent ABI values.
Related Stories
Market Data | Nov 2, 2016
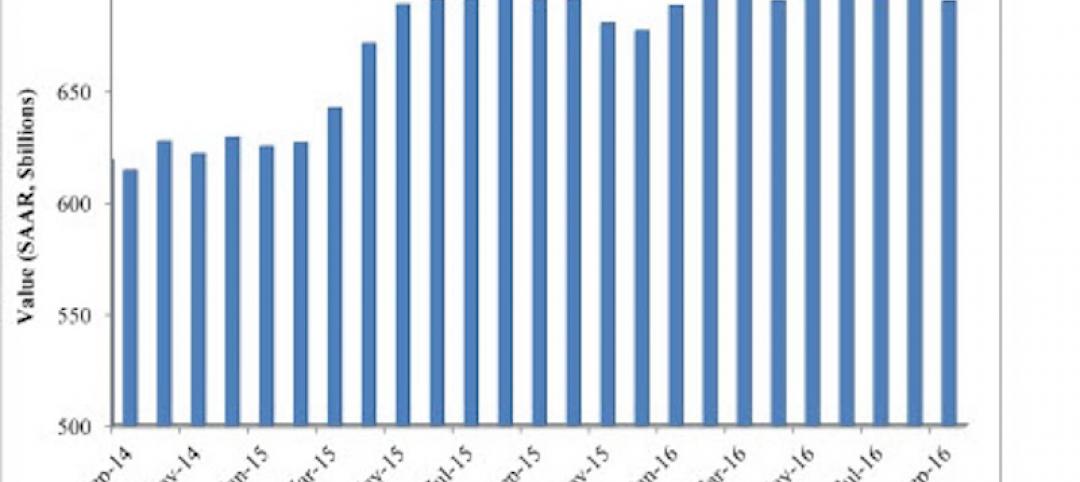
Nonresidential construction spending down in September, but August data upwardly revised
The government revised the August nonresidential construction spending estimate from $686.6 billion to $696.6 billion.
Market Data | Oct 31, 2016
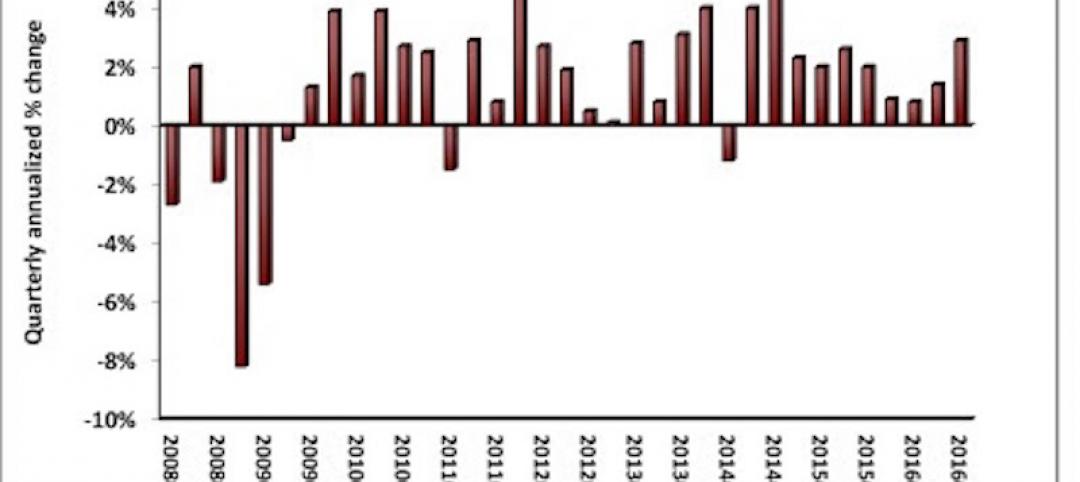
Nonresidential fixed investment expands again during solid third quarter
The acceleration in real GDP growth was driven by a combination of factors, including an upturn in exports, a smaller decrease in state and local government spending and an upturn in federal government spending, says ABC Chief Economist Anirban Basu.
Market Data | Oct 28, 2016
U.S. construction solid and stable in Q3 of 2016; Presidential election seen as influence on industry for 2017
Rider Levett Bucknall’s Third Quarter 2016 USA Construction Cost Report puts the complete spectrum of construction sectors and markets in perspective as it assesses the current state of the industry.
Industry Research | Oct 25, 2016
New HOK/CoreNet Global report explores impact of coworking on corporate real rstate
“Although coworking space makes up less than one percent of the world’s office space, it represents an important workforce trend and highlights the strong desire of today’s employees to have workplace choices, community and flexibility,” says Kay Sargent, Director of WorkPlace at HOK.
Market Data | Oct 24, 2016
New construction starts in 2017 to increase 5% to $713 billion
Dodge Outlook Report predicts moderate growth for most project types – single family housing, commercial and institutional building, and public works, while multifamily housing levels off and electric utilities/gas plants decline.
High-rise Construction | Oct 21, 2016
The world’s 100 tallest buildings: Which architects have designed the most?
Two firms stand well above the others when it comes to the number of tall buildings they have designed.
Market Data | Oct 19, 2016
Architecture Billings Index slips consecutive months for first time since 2012
“This recent backslide should act as a warning signal,” said AIA Chief Economist, Kermit Baker.
Market Data | Oct 11, 2016
Building design revenue topped $28 billion in 2015
Growing profitability at architecture firms has led to reinvestment and expansion
Market Data | Oct 4, 2016
Nonresidential spending slips in August
Public sector spending is declining faster than the private sector.
Industry Research | Oct 3, 2016
Structure Tone survey shows cost is still a major barrier to building green
Climate change, resilience and wellness are also growing concerns.


