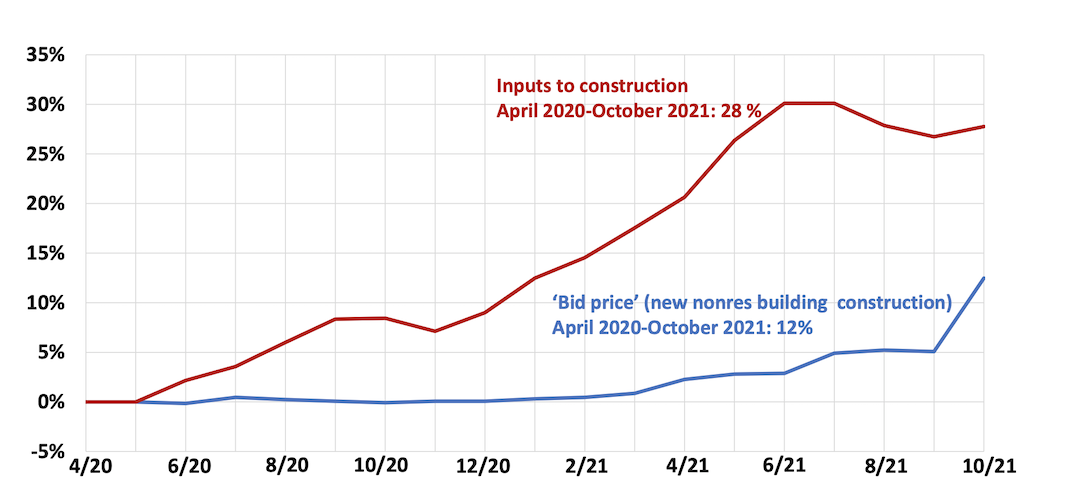
Rising construction materials prices appear to be starting to drive up the price of construction projects, according to an analysis by the Associated General Contractors of America of government data released today. Association officials noted that despite a big jump in what contractors charge for projects, the rise in materials prices is still much higher.
“After being battered by unprecedented price increases for many materials, contractors are finally passing along more of their costs,” said Ken Simonson, the association’s chief economist. “Meanwhile, supply-chain bottlenecks and labor shortages continue to impede contractors’ ability to finish projects.”
The producer price index for new nonresidential construction—a measure of what contractors say they would charge to erect five types of nonresidential buildings—jumped 7.1% from September to October and 12.6% over the past 12 months. But an index of input prices—the prices that goods producers and service providers such as distributors and transportation firms charged for inputs for nonresidential construction—climbed by an even steeper 21.1% compared to October 2020, including a 1.3% increase since September, Simonson noted.
Many products, as well as trucking services, contributed to the extreme runup in construction costs, Simonson observed. The price index for steel mill products more than doubled, soaring nearly 142% since October 2020. The indexes for both aluminum mill shapes and copper and brass mill shapes jumped more than 37% over 12 months, while the index for plastic construction products rose more than 30%. The index for gypsum products such as wallboard climbed 25% and insulation costs increased 17%. Trucking costs climbed 16.3%. The index for diesel fuel, which contractors buy directly for their own vehicles and off-road equipment and also indirectly through surcharges on deliveries of materials and equipment, doubled over the year.
Association officials urged the Biden administration and Congress to do more to address supply chain backups that are crippling construction firms and the broader economy. These measures include additional tariff relief for key construction materials. They also urged federal officials to explore other options, like waiving hours of service rules so shippers can tackle freight backlogs.
“Supply chain backlogs are clearly one of the biggest threats to the economy recovery,” said Stephen E. Sandherr, the association’s chief executive officer. “Washington officials need to be more aggressive in taking steps to get key materials moving again so construction firms can continue rebuilding the country.”
View producer price index data. View chart of gap between input costs and bid prices. View the association’s Construction Inflation Alert.
Related Stories
Multifamily Housing | Feb 15, 2018
United States ranks fourth for renter growth
Renters are on the rise in 21 of the 30 countries examined in RentCafé’s recent study.
Market Data | Feb 1, 2018
Nonresidential construction spending expanded 0.8% in December, brighter days ahead
“The tax cut will further bolster liquidity and confidence, which will ultimately translate into more construction starts and spending,” said ABC Chief Economist Anirban Basu.
Green | Jan 31, 2018
U.S. Green Building Council releases annual top 10 states for LEED green building per capita
Massachusetts tops the list for the second year; New York, Hawaii and Illinois showcase leadership in geographically diverse locations.
Industry Research | Jan 30, 2018
AIA’s Kermit Baker: Five signs of an impending upturn in construction spending
Tax reform implications and rebuilding from natural disasters are among the reasons AIA’s Chief Economist is optimistic for 2018 and 2019.
Market Data | Jan 30, 2018
AIA Consensus Forecast: 4.0% growth for nonresidential construction spending in 2018
The commercial office and retail sectors will lead the way in 2018, with a strong bounce back for education and healthcare.
Market Data | Jan 29, 2018
Year-end data show economy expanded in 2017; Fixed investment surged in fourth quarter
The economy expanded at an annual rate of 2.6% during the fourth quarter of 2017.
Market Data | Jan 25, 2018
Renters are the majority in 42 U.S. cities
Over the past 10 years, the number of renters has increased by 23 million.
Market Data | Jan 24, 2018
HomeUnion names the most and least affordable rental housing markets
Chicago tops the list as the most affordable U.S. metro, while Oakland, Calif., is the most expensive rental market.
Market Data | Jan 12, 2018
Construction input prices inch down in December, Up YOY despite low inflation
Energy prices have been more volatile lately.
Market Data | Jan 4, 2018
Nonresidential construction spending ticks higher in November, down year-over-year
Despite the month-over-month expansion, nonresidential spending fell 1.3 percent from November 2016.


