


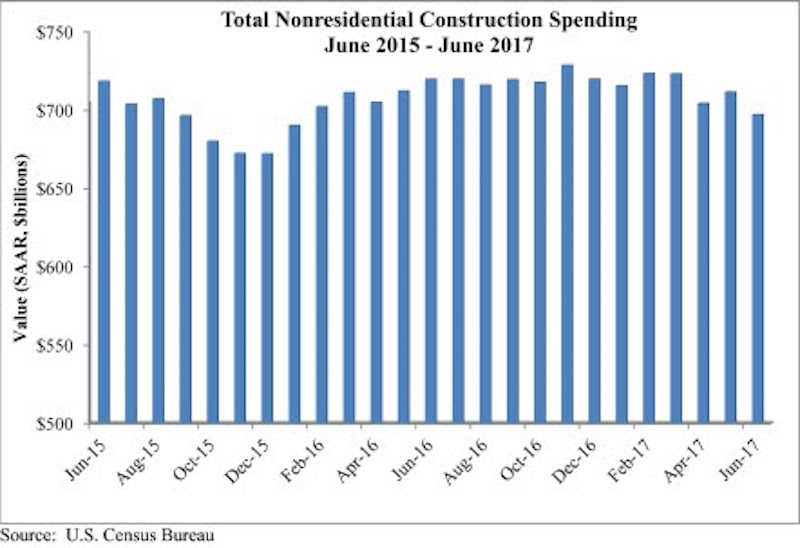
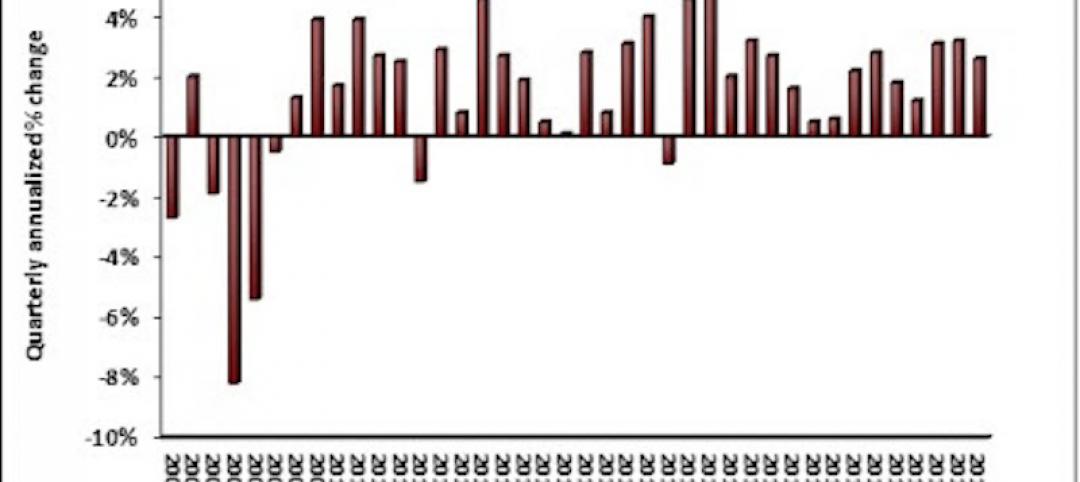
Nonresidential construction spending fell by 2% on a monthly basis in June 2017, totaling $697 billion on a seasonally adjusted, annualized basis according to an analysis of U.S. Census Bureau data released today by Associated Builders and Contractors. June represents the first month during which spending has dipped below the $700 billion per year threshold since January 2016.
June’s weak construction spending report can be largely attributed to the public sector. Public nonresidential construction spending fell 5.4% for the month and 9.5% for the year, and all twelve public subsectors decreased for the month. Private nonresidential spending remained largely unchanged, increasing by 0.1% for the month and 1.1% for the year. April and May nonresidential spending figures were revised downward by 1.1% and 0.4%, respectively.
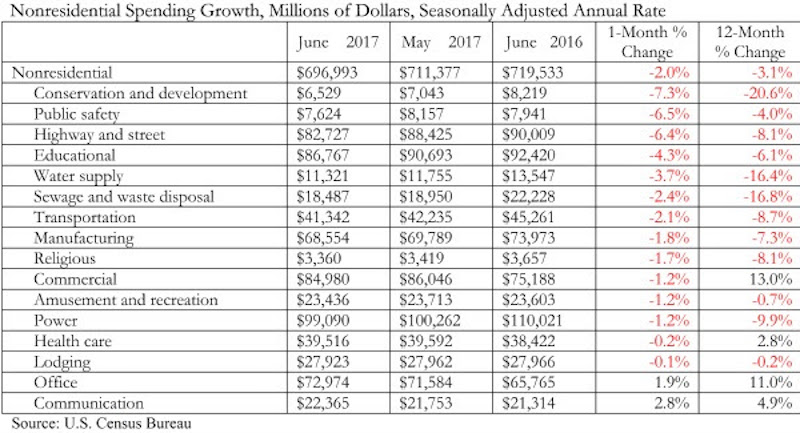
“Coming into the year, there were high hopes for infrastructure spending in America,” said ABC Chief Economist Anirban Basu. “The notion was that after many years of a lack of attention to public works, newfound energy coming from Washington, D.C., would spur confidence in federal funding among state and local transportation directors as well among others who purchase construction services. Instead, public construction spending is on the decline in America. Categories including public safety and flood control have experienced dwindling support for investment, translating into a nine percent decline in public construction spending over the past twelve months.
“On the other hand, several private segments continue to manifest strength in terms of demand for construction services,” said Basu. “At the head of the class are office construction, driven by a combination of job growth among certain office-space-using categories as well as lofty valuations, and communications, which is being driven largely by enormous demand for data center capacity.
“While there are certainly some parts of the nation experiencing significant levels of public construction, those areas have increasingly become the exception as opposed to the rule,” said Basu. “The more general and pervasive strength is in private segments. Based on recent readings of the architecture billings index and other key leading indicators, commercial contractors are likely to remain busy for the foreseeable future. The outlook for construction firms engaged in public work remains unclear.”
Related Stories

Market Data | Feb 21, 2018
Strong start for architecture billings in 2018
The American Institute of Architects reported the January 2018 ABI score was 54.7, up from a score of 52.8 in the previous month.
Multifamily Housing | Feb 15, 2018
United States ranks fourth for renter growth
Renters are on the rise in 21 of the 30 countries examined in RentCafé’s recent study.

Market Data | Feb 1, 2018
Nonresidential construction spending expanded 0.8% in December, brighter days ahead
“The tax cut will further bolster liquidity and confidence, which will ultimately translate into more construction starts and spending,” said ABC Chief Economist Anirban Basu.
Green | Jan 31, 2018
U.S. Green Building Council releases annual top 10 states for LEED green building per capita
Massachusetts tops the list for the second year; New York, Hawaii and Illinois showcase leadership in geographically diverse locations.

Industry Research | Jan 30, 2018
AIA’s Kermit Baker: Five signs of an impending upturn in construction spending
Tax reform implications and rebuilding from natural disasters are among the reasons AIA’s Chief Economist is optimistic for 2018 and 2019.

Market Data | Jan 30, 2018
AIA Consensus Forecast: 4.0% growth for nonresidential construction spending in 2018
The commercial office and retail sectors will lead the way in 2018, with a strong bounce back for education and healthcare.
Market Data | Jan 29, 2018
Year-end data show economy expanded in 2017; Fixed investment surged in fourth quarter
The economy expanded at an annual rate of 2.6% during the fourth quarter of 2017.

Market Data | Jan 25, 2018
Renters are the majority in 42 U.S. cities
Over the past 10 years, the number of renters has increased by 23 million.

Market Data | Jan 24, 2018
HomeUnion names the most and least affordable rental housing markets
Chicago tops the list as the most affordable U.S. metro, while Oakland, Calif., is the most expensive rental market.
Market Data | Jan 12, 2018
Construction input prices inch down in December, Up YOY despite low inflation
Energy prices have been more volatile lately.


