

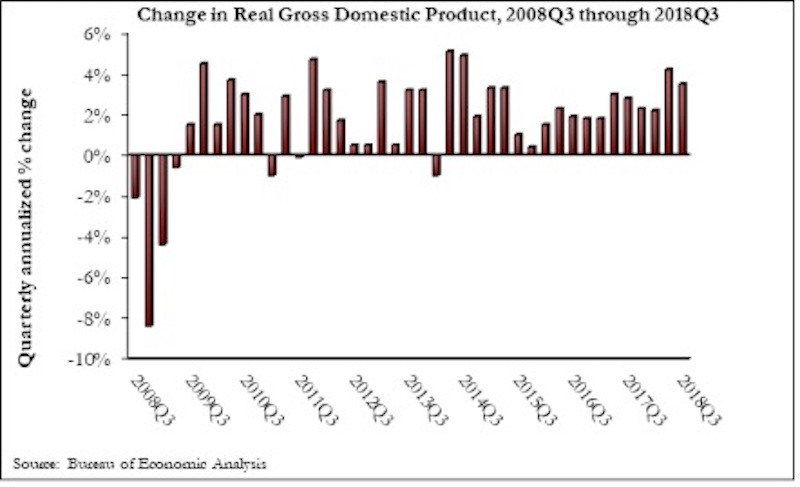
The U.S. economy expanded at a 3.5% annualized rate during the third quarter of 2018, according to an Associated Builders and Contractors analysis of U.S. Bureau of Economic Analysis data released today. This represents the first time there have been two consecutive quarters of 3%-plus growth since the beginning of 2015.
Despite the broader economic growth, fixed investment inched 0.3% lower in the third quarter. Nonresidential fixed investment increased at just a 0.8% annualized rate, a stark reversal from the 11.5% and 8.7% growth observed in the first and second quarters, respectively. Investment in structures plummeted 7.9% after increasing by 13.9% and 14.5% in the previous two quarters.
“While the GDP increased, business investment, including investment in structures, was generally disappointing,” said ABC Chief Economist Anirban Basu. “Today’s GDP release is consistent with other data indicating a recent softening in capital expenditures, which caught many observers by surprise. Coming into the year, the expectation among many was that corporate tax cuts would translate into a lengthy period of rising business investment.
“As always, there are multiple explanations for the observed slowing in capital expenditures,” said Basu. “The first is simply that this represents an inevitable moderation in fixed business investment after the stunning growth in investment registered during the year’s initial two quarters. A second explanation, however, is not nearly as benign. This explanation focuses on both the growing constraints that businesses face due to a lack of trained workers available to work on new equipment, as well as the impact of rising input costs. Corporate earnings are no longer as consistently surprising to the upside, an indication of the impact of rising business costs. It may be that the dislocation created by ongoing trade skirmishes is also inducing certain firms to invest less in equipment and structures.
“If the first explanation is correct, one would expect a bounce back in capital expenditures,” said Basu. “The logic is that the U.S. business community has taken a bit of a breather to digest all of the capital investments undertaken during the first half of 2018. However, the second would indicate economic growth and the pace of hiring to soften in 2019. That obviously would not be a welcome dynamic for America’s construction sector.”

Related Stories
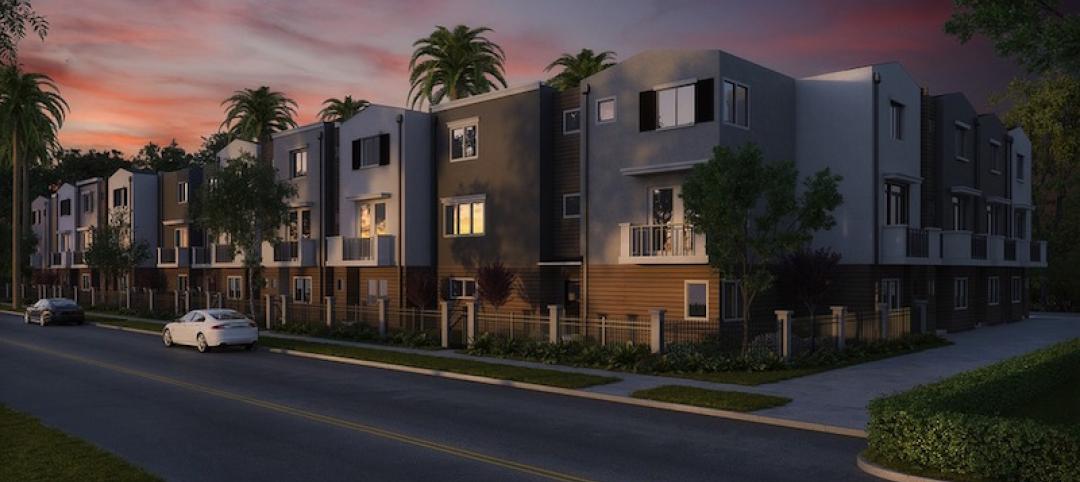
Multifamily Housing | Feb 15, 2018
United States ranks fourth for renter growth
Renters are on the rise in 21 of the 30 countries examined in RentCafé’s recent study.

Market Data | Feb 1, 2018
Nonresidential construction spending expanded 0.8% in December, brighter days ahead
“The tax cut will further bolster liquidity and confidence, which will ultimately translate into more construction starts and spending,” said ABC Chief Economist Anirban Basu.
Green | Jan 31, 2018
U.S. Green Building Council releases annual top 10 states for LEED green building per capita
Massachusetts tops the list for the second year; New York, Hawaii and Illinois showcase leadership in geographically diverse locations.

Industry Research | Jan 30, 2018
AIA’s Kermit Baker: Five signs of an impending upturn in construction spending
Tax reform implications and rebuilding from natural disasters are among the reasons AIA’s Chief Economist is optimistic for 2018 and 2019.

Market Data | Jan 30, 2018
AIA Consensus Forecast: 4.0% growth for nonresidential construction spending in 2018
The commercial office and retail sectors will lead the way in 2018, with a strong bounce back for education and healthcare.
Market Data | Jan 29, 2018
Year-end data show economy expanded in 2017; Fixed investment surged in fourth quarter
The economy expanded at an annual rate of 2.6% during the fourth quarter of 2017.

Market Data | Jan 25, 2018
Renters are the majority in 42 U.S. cities
Over the past 10 years, the number of renters has increased by 23 million.

Market Data | Jan 24, 2018
HomeUnion names the most and least affordable rental housing markets
Chicago tops the list as the most affordable U.S. metro, while Oakland, Calif., is the most expensive rental market.
Market Data | Jan 12, 2018
Construction input prices inch down in December, Up YOY despite low inflation
Energy prices have been more volatile lately.
Market Data | Jan 4, 2018
Nonresidential construction spending ticks higher in November, down year-over-year
Despite the month-over-month expansion, nonresidential spending fell 1.3 percent from November 2016.


