Analysts at Lodging Econometrics (LE) report that in the third quarter of 2021 the total U.S. construction pipeline stands at 4,837 projects/592,259 rooms, down 8% by projects and 10% by rooms year-over-year (YOY). While project numbers have seen a slight increase over second quarter totals, overall, the construction pipeline remains largely muted due to a reduced inflow of new projects in the pipeline as compared to “pre-COVID levels,” and significant hotel openings during the first half of the year which exited the pipeline. The prolonged effects of the pandemic, above average inflation, rising interest rates, and material shortages and price increases have been and will continue to be key factors in decision-making for developers through the end of the year.
However, many developers really do have a long term positive outlook on hotel development as projects in the early planning stage are up considerably, with 1,978 projects/239,831 rooms, a 27% increase by projects and 25% by rooms YOY and reaching a cyclical peak this quarter. Conversely, projects scheduled to start construction in the next 12 months are down 14% by projects and 15% by rooms YOY, with 1,824 projects/210,189 rooms at the end of the third quarter. Projects under construction were also down in Q3, ending the quarter at 1,035 projects/142,239 rooms. This is largely due to projects that have completed construction and have opened. Presently, inflation and the increasing cost and sourcing of labor and materials, combined with supply chain shortages and delays, continue to be a major variable for hotel development. In response, developers are reworking budgets, revising plans to minimize costs, and adjusting construction start and project opening dates to endure the challenges of a recovering industry.
Though the path to full recovery may be longer than originally expected, two main steppingstones aiding in the recovery have been the recent rise in hotel stock values as well as increases in lending activity. Rebounding hotel stocks and better-than-expected hotel and travel demand throughout the summer season has renewed developer sentiment.
Renovation and conversion pipeline activity remains steady at the end of Q3 ‘21, with conversion projects hitting a cyclical peak, and ending the quarter at 752 projects/79,024 rooms. Combined, renovation and conversion activity accounts for 1,253 projects and 176,305 rooms.
Through the third quarter of 2021, the U.S. opened 665 new hotels with 85,306 rooms with another 221 projects/23,026 rooms anticipated to open by the end of the year, totaling 886 projects/108,332 rooms for 2021. Our research analysts expect an increase in new hotel openings in 2022, with 970 projects accounting for 110,123 rooms forecast to open in 2022 and another 961 projects/111,249 rooms anticipated to open in 2023.
Related Stories
Market Data | Mar 29, 2017
Contractor confidence ends 2016 down but still in positive territory
Although all three diffusion indices in the survey fell by more than five points they remain well above the threshold of 50, which signals that construction activity will continue to be one of the few significant drivers of economic growth.
Market Data | Mar 24, 2017
These are the most and least innovative states for 2017
Connecticut, Virginia, and Maryland are all in the top 10 most innovative states, but none of them were able to claim the number one spot.
Market Data | Mar 22, 2017
After a strong year, construction industry anxious about Washington’s proposed policy shifts
Impacts on labor and materials costs at issue, according to latest JLL report.
Market Data | Mar 22, 2017
Architecture Billings Index rebounds into positive territory
Business conditions projected to solidify moving into the spring and summer.
Market Data | Mar 15, 2017
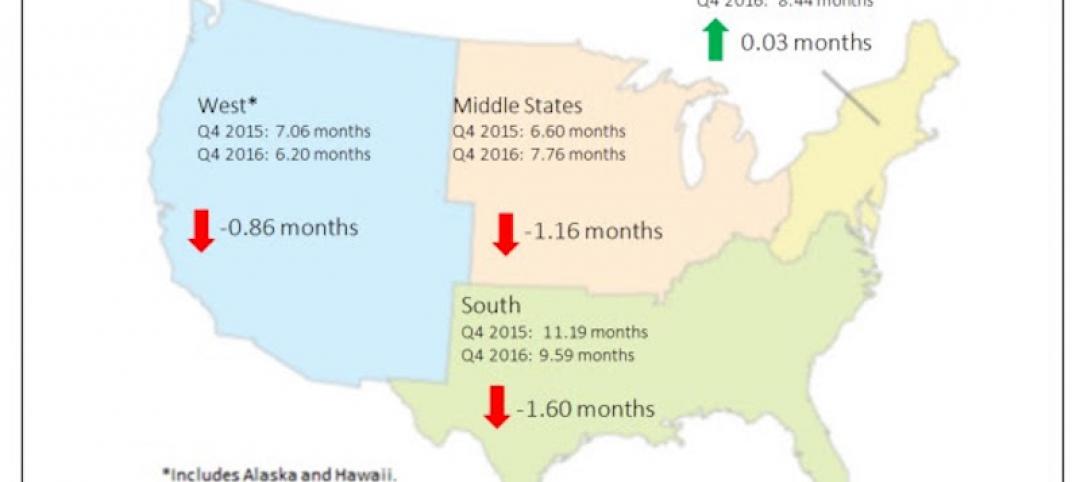
ABC's Construction Backlog Indicator fell to end 2016
Contractors in each segment surveyed all saw lower backlog during the fourth quarter, with firms in the heavy industrial segment experiencing the largest drop.
Market Data | Feb 28, 2017
Leopardo’s 2017 Construction Economics Report shows year-over-year construction spending increase of 4.2%
The pace of growth was slower than in 2015, however.
Market Data | Feb 23, 2017
Entering 2017, architecture billings slip modestly
Despite minor slowdown in overall billings, commercial/ industrial and institutional sectors post strongest gains in over 12 months.
Market Data | Feb 16, 2017
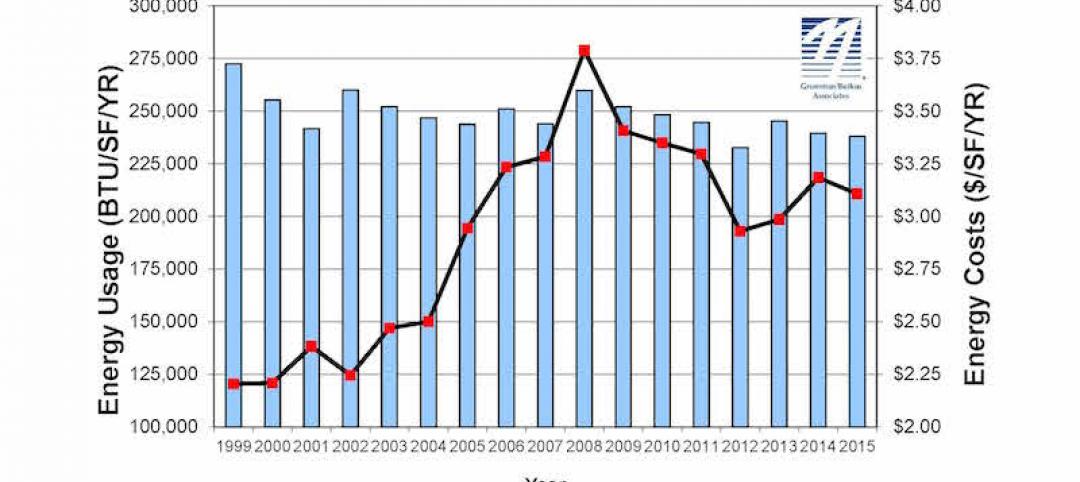
How does your hospital stack up? Grumman/Butkus Associates 2016 Hospital Benchmarking Survey
Report examines electricity, fossil fuel, water/sewer, and carbon footprint.
Market Data | Feb 1, 2017
Nonresidential spending falters slightly to end 2016
Nonresidential spending decreased from $713.1 billion in November to $708.2 billion in December.
Market Data | Jan 31, 2017
AIA foresees nonres building spending increasing, but at a slower pace than in 2016
Expects another double-digit growth year for office construction, but a more modest uptick for health-related building.


